REGISTRO DOI: 10.5281/zenodo.8126719
Tayrine de Souza Rocha, Pedro Augusto Farias de Souza, Victor Hugo Santiago Costa Pinto, Regiane Silva Kawasaki Francês, Sintia Silva de Almeida, Vinicius Augusto Carvalho de Abreu.
ABSTRACT
High-throughput studies of biological systems are rapidly accumulating a large body of omic-scale data. The analysis of data that constitute various types of omics (Genomics, Metagenomics, Transcriptomics and Proteomics) from different experiments, play a role in the process of asking new questions that correlate between different combinations of these types of data. Thus, a systemic view is needed that addresses the use of the integration of these omics. The visualization of information or the use of a multidimensional view is increasingly relevant in the multi-omics theme. This article seeks to demonstrate the analysis of the four most cited tools for the integration of large volumes of multi-omic data, with regard to multidimensional visualization, suggesting evaluation criteria for the development or even improvement of new tools.
KEYWORDS
datasets, neural networks, gaze detection, text tagging
INTRODUCTION
The increasing availability of high-throughput technologies in the field of omics analysis have generated an increasing amount of data, which seek to represent multiple layers of biological information (Barthet MF.). The development of these technologies and computational frameworks has enabled the examination of biological systems at a high level of detail (Picard M, Scott-Boyer MP, Bodein A, Périn O, Droit A. [n. d.]). However, the volume of data is extensive and with this, identifying the appropriate methodology for analysis is a challenging but fundamental activity for extracting relevant information.
The effort and cost of data collection and storage can be fruitless in complex scenarios to define how to extract relevant data to answer the queries desired by users (Arif M, Zhang C, Li X, Güngör C, Çakmak B, Arslantürk M, et al. [n. d.]). In light of this, the multi-omics approach (Knaflic CN. [n. d.]) is a promising analysis that consists of combining two or more omics methods to obtain more accurate insights and more assertive predictions, however it is a complex and data-intensive analysis.
Tools designed to analyze large volumes of omics data have been developed to explore the relationships between different biological readouts (Kopczynski D, Coman
C, Zahedi RP, Lorenz K, Sickmann A, Ahrends R. [n. d.]) and provide a more effective understanding of these systems. However, there are challenges to overcome, from selecting relevant data to understanding the relationship of these heterogeneous data. Other tools exploit various information visualization techniques (Thomas JJ, Cook KA. [n. d.]). These techniques contribute to information analysis and understanding through computer graphics, human computer interfaces, and data mining (Agrawal R, Imielinski T, Swami A. [n. d.]).
The visual representation of multi-omics data must express important properties and how different elements are related to each other
(Shneiderman B. [n. d.]). In addition, one should consider how best to map the information to a graphical representation that facilitates its interpretation by users and provides means to limit the amount of information received by the user but allowing the user to explore such information at varying levels of detail. Although there are several visualization tools available, there is a lack of studies of both their efficiency and applicability in supporting the needs of users in their quest for better visualization of multi-economic data (Valiati E. [n. d.]). In addition, it is observed that the community needs a set of evaluation criteria that includes, in addition to visual representations, the interaction mechanisms needed to perform the tasks.
One way to respond to such needs is to evaluate the visualizations generated and the interactive mechanisms provided by the techniques through the application of a specific usability evaluation method. Additionally, there are several methods for usability testing (Herbert J., n.d.), but there is a great difficulty in the stages of implementation and experimentation of these methods. In usability testing it is necessary to consider some important and complex aspects, such as user satisfaction and levels of experience (Teste de usabilidade: o que é e para que serve?).
The objective of this study focuses on compiling a set of good practices for visualization and creating evaluation criteria that can be adopted for multiomics data visualization tools. Although this subject is already covered in the literature, there are few approaches in the domain of multi-omics data analysis, since visualization is a very broad topic, but we cannot generalize and recommend one practice for each type of visualization.
MATERIAL AND METHODS
This section discusses the steps of the study. Initially, databases were defined to find articles about multi-omics data visualization tools. Afterwards search strings were created to select the articles and a literature search was performed for theoretical foundation. Since the first search returned many articles, it was necessary to create a first set of criteria, called selection criteria, that had the objective of supporting the selection of the most relevant papers. With this result, the most cited tools were selected. These tools were analyzed and tested. Finally, the evaluation criteria were created, and used to support the testing of the tools and the analysis of the results.
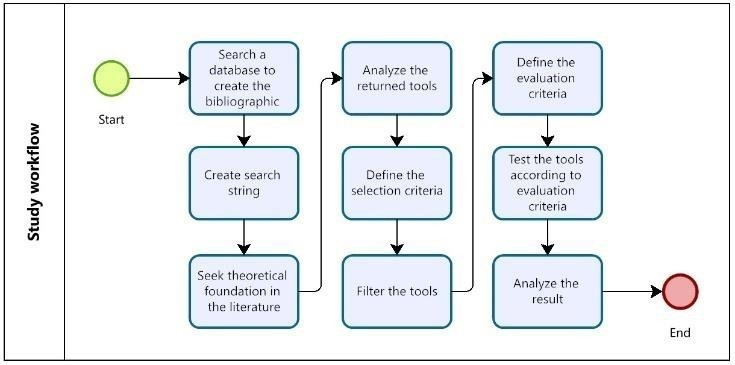
Figure 1: Illustration of the study workflow.
We evaluated scientific articles published in PubMed and IEEE Xplore. These databases were chosen because they belong to the Health and Exact areas of knowledge, respectively. The descriptors was established using keywords, as shown in Table 1.
Base Search String N. of articles PubMed ((((multiomics data[Title]) OR (omics data integration[Title])) OR (visualization of multiomics data[Title])) OR (multiomic data tools[Title])) OR (multidimensional data visualization[Title]) 165 IEEE Xplore (“Documento tittle”: multiomics data) OR (“Document Title: omics data integration) OR (“Document Title: Visualization of multiomics”) 63
Regarding the analysis of the articles found, it was found in the literature that there are some elements that together lead to success in visualization and effective communication with the data, they are: Context (Iliinsky N, Steele J., n.d.), Colors [48, 49], Typography (Iliinsky N, Steele J., n.d.) and Saturation [24].
Evaluation of human-computer interaction
Properly designed systems considering the real needs, capabilities, and expectations of their potential users have greater chances of being accepted and effectively used [37]. In the case of visualization of omics data, usability is one of the most important factors. The analysis depends on the tool’s ability to provide the user
with the ability to select a particular piece of information and from there, explore varying levels of detail [38]. Therefore, the visualization tool must provide all the necessary interaction features to support the data analysis activity adequately and efficiently. Otherwise, erroneous conclusions may be collected. Usability is not a one-dimensional property of an interface but is traditionally associated with five elements, which are: ease of learning, efficiency of use, subjective user satisfaction, user errors, and recall (Herbert J., n.d.).
Interaction Engine Techniques
Interaction mechanisms contribute to the understanding of data representation [40]. Human interaction completes the cycle between visual forms and control of display parameters in performing some tasks. The most obvious form of interaction is direct manipulation that allows, for example, dragging a node in a graph to the center of the screen (Donath, J., n.d.). Human interaction with visual structures and mapping parameters creates an information workspace that leads to the development of a visual sense. The task of interaction is to provide means to gain new perspectives on data and to better understand, filter results and request new visual representations (Qiu Y Zhao P Zou Q. Yang Y, Tian S. [n. d.]) . Shneiderman (Shneiderman B. [n. d.]) presents seven tasks when interacting with large data sets:
- Overview: Gets an overview of all data;
- Zoom: focuses on items of interest;
- Filtering: Discards items that are not of interest;
- Detail-on-demand: select an item or a group and get more detail when needed;
- Relate: visualizes the relationships between items;
- History: keeps the history of actions to enable undo, redo and refine options progressively;
- Extraction: allows the extraction of subsets and query parameters. Multidimensional Visualization
Multi-dimensional visualization is a widely used technique for exploring and understanding omics datasets. These types of data often have large numbers of variables and samples, making it difficult to analyze them with traditional statistical methods alone. There are several approaches to multidimensional visualization of omics data, including classical techniques and more advanced methods. Some of the most commonly used techniques are:
- Principal Component Analysis (PCA): Principal Component Analysis or PCA is a multivariate analysis technique that can be used to analyze relationships among many variables and explain these variables in terms of their inherent dimensions (components) (Oliveira B., 2019)
- Principal Coordinate Analysis (PCoA): is an unrestricted ordination analysis that accepts data of different types, such as continuous, categorical, ordinal, and binary, among others. Thus, PCoA is applied for cases where the Euclidean distance is not applied (as in PCA). Thus, the first step of the analysis is to calculate a Yesilarity or distance matrix (discussed above). Then the steps to obtain eigenvalues and eigenvectors are quite Yesilar to PCA. Yesilarly, the axes of the PCoA and the values or positions of the objects on those axes represent the Yesilarity (or difference) relationship based on the descriptors of those objects. The difference, in this case, is that the PCoA represents a non-Euclidean space, which will be affected by the choice of Yesilarity method (Capítulo 9 – Análises Multidimensionais.);
- Kohonen’s Maps (Self-Organizing Maps – SOM): The Self- Organizing Maps (SOM) were developed by Kohonen in 1982. They have unsupervised learning and strong neurophysiological inspiration, different from all artificial neural networks developed until then. It is based on Competitive Learning (Cambuim, L.; n.d.); Analysis and Selection
After obtaining the articles according to the search methodology described in Table 1,
37 tools capable of performing multi-omics data integration were identified described in Table 2. For the analysis of these tools, five criteria were established for selection that helped narrow down our research universe, and case the all criteria is sucefull, the tool is approved to testing:
- The tool must have been returned from the literature review.
- The tool must be platform independent, not be a plugin or just a database.
- The omics supported in the tool should be at a minimum: genomics and transcriptomics.
- The tool must have a free license.
- The tool must be web-based.
Tools Type Omics No charge Onl ine Eval. Ref. LinkedOmics Plataform Genomics, Epigenomics and omics Yes Yes Yes Seo J Kim S Lee S. Jang Y, Yu N. (n.d.) STATegra Plugin Genomic, Epigenomic, Transcriptomic and Matabolomic Yes – No Song B Cristea IM. Kennedy MA, Greco TM. (n.d.) TimeOmics Plugin – Yes – No Knaflic CN. [n. d.] iNetModels 2.0 Plataform Proteomic, Matabolomic and MetaGenomic Yes Yes Yes Koblitz J, Schomburg D, Neumann- Schaal M. [n. d.] MiBiOmics Plataform – Yes – No Koh HWL, Fermin D, Vogel C, Choi KP, Ewing RM, Choi H. [n. d.] Musa Plugin Genomic, Transcriptomic and Proteomic Yes – No Kopczynski D, Coman C,
Zahedi RP,
Lorenz K,
Sickmann A, Ahrends R. [n. d.]IDARE2 Plugin – Yes – No Lin D,
Yalamanchili
HB, Zhang X,
Lewis NE,
Alves CS, Groot
J, et al. [n. d.]iOmicsPASS Plugin Genomic, Transcriptomic and Proteomic Yes – No Liu H, Wang F, Xiao Y, Tian Z, Wen W, Zhang X, et al. [n. d.] ICAF – Insuficiência Cardíaca Plataform Genomic Yes – No Liu X, Xu K, Tao X, Yin R, Ren G, Yu M, et al. [n. d.] OmicsAn alyst Plataform Genomic, Transcriptomic, Proteomic and Matabolomic Yes Yes Yes Merwin NJ, Mousa WK, Dejong CA, Skinnider MA, Cannon MJ, Li H, et al. [n. d.] Panomicon Plataform Genomic, Transcriptomic and Proteomic Yes Yes No Colaprico A Liu L Silva TC Sun X et al. Odom GJ, Ban Y. [n. d.] MetaboMAP S Plataform Transcriptomic, Proteomic and Matabolomic Yes – No Zhu LJ. Ou J. [n. d.] EU MISTURO Plugin Transcriptomic, Epigenomic, Matabolomic, Proteomic Yes – No Pfau T, Galhardo M, Lin J, Sauter T. [n. d.] ProTrack Plataform Genomic and Proteomic Yes – No Picard M, Scott- Boyer MP, Bodein A, Périn O, Droit A. [n. d.]. multiSLIDE Plugin Transcriptomic and
ProteomicYes – No Planell N,
Lagani V,
Sebastian-Leon
P, van der Kloet
F, Ewing E, Karathanasis N, et al. [n. d.]O2PLS Method Genomic, Transcriptomic, Proteomic and Matabolomic Yes – No Preece J. [n. d.]. SynLeGG Plataform Genomic Yes – No Scholtz J. [n. d.]. CHOmics Plataform Transcriptomic and Proteomic Yes – No Shneiderman B. [n. d.] Mergeômic a 2.0 Web server Genomic, Epigenomic, Transcriptomic, Proteomic e Matabolomic Yes – No Thomas JJ, Cook KA. [n. d.] PaintOmics 3 Plataform Transcriptomic, Proteomic and Matabolomic Yes – No Trygg J, Wold S. [n. d.]. MODEM Database Genomic, Transcriptomic, Matabolomic and Phenotype Yes – No Maniou MC Psomopoulos F. Tsagiopoulou M, Pechlivanis N. [n. d.] DeepRiPP Plataform Genomic and Matabolomic Yes – No Valiati E. [n. d.] MOBCdb Databas e Genomic, Transcriptomic and Epigenomic Yes – No Vasaikar SV, Straub P, Wang J, Zhang B. [n. d.] IPPC Plataform Genomic Yes – No Liu J Zhang Y. Wang J, Qi M. [n. d.] MDICC Método – – – No Wang Z, Wei P. [n.d.] MONGKIE Databae Genomic, Transcriptomic and Epigenomic Yes – No Wexler S, Shaffer J, Cotgreave A. [n. d.] InterTADs Plataform Genomic, Transcriptomic and Epigenomic Yes No No Wong B. [n. d.]. PathwayPCA Plugin – Yes – No Wu J, Zhao M, Li T, Sun J, Chen Q, Yin C, et al. [n. d.] HT-OMNTI Platafor Transcriptomic and Proteomic Yes Yes No Xie B, Yuan Z, Yang Y, Sun Z, Zhou S, Fang X. [n. d.]. INTEGRAR Pipeline Computacion al Transcriptomic and Matabolomic Yes Yes No Yamaguchi J. [n. d.]. CARMO Plataform Transcriptomic and Epigenomic Yes Yes No Qiu Y Zhao P Zou Q. Yang Y, Tian S. [n. d.]. TrackViewer Plugin – Yes – No Liu J Zhao H Chen W Wang H et al. Ye X, Peng F. [n. d.]. ChromoMap Plataform Genomic, Transcriptomic and Epigenomic Yes No No Zanfardino M, Castaldo R, Pane K, Affinito O, Aiello M, Salvatore M, et al. [n. d.] Galbase Plataform Transcriptomic and Epigenomic Yes Yes No Zhou G, Ewald J, Xia J. [n. d.]. ExpressVis Plataform Microarray, dados de RNA- seq and dados de Proteomic Yes Yes No Zoppi J, Guillaume JF, Neunlist M, Chaffron S. [n. d.]. RGmatch Script Python Genomic and Transcriptomic Yes Yes No Furió-Tarí, P., Conesa, A. &
Tarazona, S.
(2016)KBCommons Knwoedge base Transcriptomic,
Proteomic, Matabolomic and EpigenomicYes – No S. Zeng, Z.
Lyu, S. R. K. Narisetti, D.
Xu and T.
Joshi, (2018)
Selection for descriptive analysis
Table 3 presents a set of four tools selected from the established criteria. These tools will be used to validate the evaluation criteria.
Tabela 3: Selected tools.
Tools Site Omics Analyst www.omicsanalyst.ca/ Panonomicon toxygates.nibiohn.go.jp/ panomicon/ iNetModels 2.0 https://inetmodels.com/ LinkedOmics www.linkedomics.org
Descriptive Analysis of the Tools
OmicsAnalyst – This is a web-based, easy-to-use platform. It enables users to run a wide variety of well-established data- driven approaches for multi-omics integration and visually explore their results in a clear and meaningful way. To help navigate complex multi-omics analysis scenarios, these approaches are organized into three visual analysis tracks, equipped with comprehensive options for parameter customization, visualization customization and targeted analysis (Zoppi J, Guillaume JF, Neunlist M, Chaffron S. [n. d.]).
iNetModels 2.0 – It is an interactive database and visualization platform for Multi-
Omics Biological Networks (MOBNs) that describes the associations between clinical chemistry, anthropometric parameters, plasma proteomics, plasma metabolomics, as well as metagenomics for oral and intestinal microbiome obtained from the same individuals. In addition, iNetModels includes tissue- and cancer-specific gene coexpression networks (GCNs) to explore connections between specific genes. This platform allows users to interactively explore the association of a single feature with other omics data and customize its particular context (e.g. male/female specific). Users can also register their data for sharing and visualization of MOBNs and GCNs (Arif M, Zhang C, Li X, Güngör C, Çakmak B, Arslantürk M, et al. [n. d.]).
LinkedOmics – The LinkedOmics database contains multi-omics and clinical data for 32 cancer types and a total of 11,158 patients from The Cancer Genome Atlas (TCGA) project. It is also the first multi-omics database that integrates global mass spectrometry (MS)-based proteomic data generated by the Consortium for Clinical Proteomic Tumor Analysis (CPTAC) on selected TCGA tumor samples. In total, LinkedOmics has more than one billion data points (Vasaikar SV, Straub P, Wang J, Zhang B. [n. d.]).
Based on the analysis found in the theoretical background for a concordant visualization (Dzemyda, G., Kurasova, O., Žilinskas, J.; 2012; TAO, Ying et al.; 2004), although the criteria in Bioinformatics is not clearly defined, we propose evaluation criteria from the perception of visualization, together with the metrics evaluation, allowing a comparative study to become possible. Table 4 describes each criterion that will be used to evaluate the instruments and the metrics explained are present in Table 5. The sets used for the tests were the bases provided by the tools themselves. The criteria used here were created with the consolidation of knowledge acquired among data/information visualization and visualization techniques, varying between types of visualization.
- A variety of colors are used to define categories, with a defined number of colors for the categories, ranged from 6 to 20 colors
- The data is labeled directly. Ideally, data labels next to the data rather than in a separate legend (e.g. at the top or next to the bars and next to the lines). Legends should be eliminated/incorporated whenever possible because eye movement between legend and data can interrupt the brain’s attempts to interpret the graph.
- The should bleed the surrounding Page or slide, rather than be contained by a border. Graphics should be without a border line
- Display the value of the markers (items) in relation to certain dimensions. Example, when you pass the mouse over the items in certain dimensions, you can inform the value of each item corresponding to the dimension of interest at that moment or the value of the item referring to the closest dimension.
- Display data detail from user interaction. It is possible to interact with the tool to the point of getting a more detailed view of the desired data.
- The items informed and presented in data can select an individual or group and must informate details of items, if the details exist.
This step consists of the following phases: Evaluate the selected tools (detailed in section 2.6) based on the evaluation criteria (section 2.8). Table 5 shows the list of criteria in the first column (1-7) and the tools in the subsequent columns. In cases where a criterion is satisfied for a given tool, it is indicated with an “X” in the “Pres.” column. Otherwise, it is indicated with this marker in the “Missing” column. For example, for the Omics Analyst tool, all criteria were met except for criteria 4 and 6.
Table 4- Criteria Evaluation
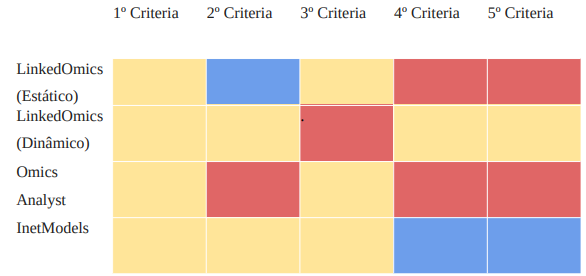
Yellow – Yes, Red – No, Blue – Not express clearly
RESULTS AND DISCUSSION
Evaluation criteria can be defined as a benchmark. They can be understood as the detail of the content, what is essential, what makes it indispensable for understanding the knowledge in its entirety [6]. Criteria are principles that will serve as a basis for judging the quality of performances, understood here not only as the execution of a task, but as the mobilization of a series of attributes that converge towards it. The criteria defined in this paper were selected based on the literature to identify whether multiomics tools are developed using recommended practices. The summarization of the results of applying the criteria is presented in Table 5.
These criteria can support the construction of new tools for multi-omics data analysis.
The results based on the application of the visualization criteria are discussed below.
The visualization provided in the tool has a limit of 6 to 12 colors for categorization, no more than 20 colors?
Using colors to encode categories is to limit the selection to about six colors ideally, no more than 12 and absolutely no more than 20 colors considering corresponding categories. This will allow different colors to be selected so that they can be easily differentiated and clearly named (Iliinsky N, Steele J., n.d.).(Iliinsky N, Steele J., n.d.) The four tools analyzed have many similarities in terms of the colors used to demarcate the data categories. However, the OmicsAnalyst tool stands out by limiting the number of colors when combined with the other criteria, such as border overflow and dimensions.
Data labels are next to the data rather than in a separate legend (e.g., at or near the top of bars and next to lines). Legends should be eliminated or incorporated whenever possible because eye movement between the legend and the data can interrupt the brain’s attempts to interpret the graph.
Whenever it is necessary to put information in front of the audience, cognitive load is generated and asking them to use their brain power to process the information. Visual saturation creates a cognitive load. Excessive however the goal is to eliminate everything that gets in the way of conveying the message and place the caption next to the data they describe [24]. Considering evaluation criterion 3, in all the analyzed tools the data is labeled directly providing a more direct and clear representation of the information. However, with the exception of the Panamicon tool this direct representation does not exist causing confusion or misinterpretation of the data.
The graphic has no border line. The graphic should bleed into the surrounding page or slide, rather than be contained by a border.
Graphics should have no border line and should occupy the entire page. If it is extremely necessary for the graphic to have grid lines. It is advisable to make them thin by using light colors, such as gray. The lines cannot compete visually with the data, it is advisable to use distinct colors for each line of the graph. Or get rid of them completely, this allows for a higher contrast and the data stands out more [24]. All the tools analyzed passed evaluation criterion 4 with the exception of the Omic Analyst tool. These tools provide a deeper and more detailed view of the data, allowing a more accurate analysis and a more complete understanding of the context in which they are inserted.
The tool must have a resource that allows, when necessary, to show the value of the markers (items) in relation to certain dimensions. That is, when the mouse is over the items in certain dimensions, the value of each item corresponding to the dimension of interest at that moment or the value of the item referring to the closest dimension can be informed.
This detailed view is necessary, just as it is necessary to have an overview of the rest of the information (global context). Considering evaluation criterion 7, the Omic Analyst tool does not meet the criteria’s requirements, as it is not possible to visualize the value of the indicated dimension.
The tool allows interactions to the point of getting a more detailed view on a specific piece of data.
Interaction in omics systems is of great importance because it enables a more comprehensive and integrated understanding of complex biological systems. This multidimensional approach is essential for significant advances in medicine, biotechnology, ecology, and related fields, leading to more accurate diagnoses, personalized therapies, and a better understanding of organisms and ecosystems. The tools analyzed against evaluation criterion 8 have effective levels. Interactive analysis makes it possible to refine and customize the results. By using filters and adjustable parameters, it is possible to target the analysis to a specific piece of data. This flexibility is crucial for users to be able to explore different scenarios and answer specific questions regarding the multi-economic data under analysis.
The items informed and presented in data can select an individual or group and must informate details of items, if the details exist.
The possibility of selecting data individually, or in a grouped manner, allowed for restricted interpretation to certain scenarios. Through the work of Shneidermen (1996), there is a need for such functionality, since this interaction allows for organizing and ordering the data in a more restrictive manner, as well as contributing to possible data extraction
CONCLUSION
In this paper, we presented eight criteria for the analysis of multidimensional visualization of multi-economic data from an overview of publications from two databases. These evaluation criteria include an avant-garde visualization as it is applied to multi-omics data, which is typically, unorthodox data, showing little literature on the topic. This initial work started from criteria that can be used for future tests based on homogeneous data for all tools and consequently be an applied guide for best practices in multi-omics data visualization.
REFERENCES
Agrawal R, Imielinski T, Swami A. [n. d.]. Mineração de banco de dados: umaperspectiva de desem-penho.
Allendes Osorio RS, Nyström-Persson JT, Nojima Y, Kosugi Y, Mizuguchi K,NatsumeKitatani Y. [n. d.]. Pannomicon: Um ambiente baseado na web paraanálise interativa e visual de dados multi-ômicos.
Arif M, Zhang C, Li X, Güngör C, Çakmak B, Arslantürk M, et al. [n. d.].iNetModels .: uma visualização interativa e banco de dados de dados multiômicos.
Barthet MF. [n. d.]. Lógicas interativas e ergonômicas: modelos e métodos deconcepção.
Bodein A, Scott-Boyer MP, Perin O, Lê Cao KA, Droit A. [n. d.]. timeOmics: um pacote R para integração de dados multi-ômicas longitudinais.
Calinawan AP, Song X, Ji J, Dhanasekaran SM, Petralia F, Wang P, et al. [n. d.].Pro- Track: Um Navegador de Dados Multi-Omics Interativo para EstudosProteogenômi- cos. Proteomic. Colaprico A Liu L Silva TC Sun X et al. Odom GJ, Ban Y. [n. d.]. PathwayPCA:um pacote R/Bioconductor para análise integrativa baseada em caminhos dedados multi-Omics.
Donath, J. [n. d.]. Visual Who: animating the affinities and activities of anelectronic.
Furió-Tarí P, Conesa A, Tarazona S. [n. d.]. RGmatch: combinando regiõesgenômi- cas com genes proximais na integração de dados ômicos.
Fu W, Wang R, Xu N, Wang J, Li R, Asadollahpour Nanaei H, et al. [n. d.].Galbase: um repositório abrangente para integrar dados multi-ômicos de frango.
Galuzzi BG Bonanomi M Gaglio D Mangano E et al. Di Filippo M, Pescini D. [n.d.]. INTEGRAR: integração de dados multi-ômica baseada em modelo paracaracterizar a regulação metabólica em vários níveis.
Ghosh S, Datta A, Choi H. [n. d.]. multiSLIDE é um servidor web para explorarelementos conecta-dos de caminhos biológicos em dados multi-ômicos. Herbert J. [n. d.]. Métodos para avaliação da qualidade de software.
Hernández-de-Diego R, Tarazona S, Martínez-Mira C, Balzano-Nogueira L,Furió- Tarí P, Pappas GJ, et al. [n. d.]. PaintOmics : um recurso da web paraanálise de caminhos e visualização de dados multi-ômicos.
Iliinsky N, Steele J. [n. d.]. Projetando visualizações de dados.
Knaflic CN. [n. d.]. Contar histórias com dados: um guia de visualização de dadospara profissionais de negócios.
Koblitz J, Schomburg D, Neumann-Schaal M. [n. d.]. MetaboMAPS: Compartilhamento de vias e visualização de dados multi-ômicas em contexto metabólico.
Koh HWL, Fermin D, Vogel C, Choi KP, Ewing RM, Choi H. [n. d.]. iOmicsPASS:integração baseada em rede de dados multiômicos para descoberta preditiva desub-rede.
Kopczynski D, Coman C, Zahedi RP, Lorenz K, Sickmann A, Ahrends R. [n. d.].MultiOMICS: uma perspectiva técnica crítica sobre abordagens de lipidômicainte- grativa.
Lin D, Yalamanchili HB, Zhang X, Lewis NE, Alves CS, Groot J, et al. [n. d.].CHOmics: Uma ferramenta baseada na web para análise de dados multi-ômica evisualização interativa em linhas de células CHO.
Liu H, Wang F, Xiao Y, Tian Z, Wen W, Zhang X, et al. [n. d.]. MODEM:envoltório de dados multi-ômicos e mineração em milho.
Liu J Zhang Y. Wang J, Qi M. [n. d.]. CARMO: uma plataforma de anotaçãoabrangente para ex-ploração funcional de dados multi-ômicos de arroz.
Liu J Zhao H Chen W Wang H et al. Ye X, Peng F. [n. d.]. IPPC: uma plataformainterativa para integração e análise de dados multi-ômicas de câncer depróstata.
Liu X, Xu K, Tao X, Yin R, Ren G, Yu M, et al. [n. d.]. ExpressVis: um servidor webinterativo orientado a biólogos para explorar dados multi-ômicos.
Maniou MC Psomopoulos F. Tsagiopoulou M, Pechlivanis N. [n. d.]. InterTADs:integração de dados multi-omics em domínios topologicamente associados,aplicação à leucemia linfocítica crônica.
Merwin NJ, Mousa WK, Dejong CA, Skinnider MA, Cannon MJ, Li H, et al. [n. d.].O DeepRiPP integra dados multiômicos para automatizar a descoberta de novosprodutos naturais sintetizados ribossomalmente.
[n. d.]. Análise de Componentes Principais. https://site.statplace.com.br/blog/ analise-decomponentes-principais/
[n. d.]. Capítulo – Análises Multidimensionais.
[n. d.]. Teste de usabilidade: o que é e para que serve?https://brasil.uxdesign.cc/ teste-deusabilidade-o-que-e-para-que-servedeeb
[n. d.]. TMapas Auto-Organizáveis de
Kohonen.https://www.cin.ufpe.br/~lfsc/cursos/introducaoainteligenciaartificial/IA-Aula-
MapasAutoOrganizaveis.pdf
OCDE. [n. d.]. Aplicando critérios de avaliação cuidadosamente.
Pfau T, Galhardo M, Lin J, Sauter T. [n. d.]. IDARE – Yesultaneous Visualizationof Multiomics Data in Cytoscape. Metabólitos.
Picard M, Scott-Boyer MP, Bodein A, Périn O, Droit A. [n. d.]. Estratégias deintegração de dados multi-ômicos para análise de aprendizado de máquina.
Planell N, Lagani V, Sebastian-Leon P, van der Kloet F, Ewing E, KarathanasisN, et al. [n. d.]. STATegra: Integração de Dados Multi-Omics – Um EsquemaConceitual com um Pipeline de Bioinformática.
S. Zeng, Z. Lyu, S. R. K. Narisetti, D. Xu and T. Joshi, “Knowledge Base Commons (KBCommons) v1.0: A multi OMICS’ web-based data integration framework for biological discoveries,” 2018 IEEE International Conference on Bioinformatics and Biomedicine (BIBM), Madrid, Spain, 2018, pp. 589-594, doi: 10.1109/BIBM.2018.8621369.
Preece J. [n. d.]. Interação humano-computador.
Qiu Y Zhao P Zou Q. Yang Y, Tian S. [n. d.]. MDICC: novo método paraintegração de dados multi-ômicas e identificação de subtipos de câncer.
Rodriguez Lopez CM. Anand L. [n. d.]. ChromoMap: um pacote R paravisualização interativa de dados multi-ômicos e anotação de cromossomos.
Scholtz J. [n. d.]. Métricas para avaliação de sistemas de interação deinformações humanas. Interagindo com Computadores.
Seo J Kim S Lee S. Jang Y, Yu N. [n. d.]. MONGKIE: uma ferramenta integradapara análise de rede e visualização de dados multi-ômicos.
Shneiderman B. [n. d.]. The eyes have it: a task by data type taxonomy for information views. In: Proceedings.
Song B Cristea IM. Kennedy MA, Greco TM. [n. d.]. HTT-OMNI: Umaplataforma baseada na Web para exploração de interação Huntingtin eintegração de dados multi-omics.
Thomas JJ, Cook KA. [n. d.]. Uma agenda de análise visual.
Trygg J, Wold S. [n. d.]. O-PLS, um método de regressão variável latente (LVR)de dois blocos (XY) com um filtro OSC integral.
Valiati E. [n. d.]. Avaliação de usabilidade de técnicas de visualização deinformações multidimensionais. Vasaikar SV, Straub P, Wang J, Zhang B. [n. d.]. LinkedOmics: analisando dadosmulti-ômicos dentro e entre tipos de câncer. Pesquisa de Ácidos Nucleicos.
Wang Z, Wei P. [n. d.]. IMIX: uma abordagem de modelo de mistura multivariadapara análise de associação por meio de integração de dados multiômica.Wappett M, Harris A, Lubbock ALR, Lobb I, McDade S, Overton IM. [n.d.]. SynLeGG: análise e visualização de dados multiômicos para descoberta decâncer ’calcanhares de Aquiles’ e relações de função gênica. Wexler S, Shaffer J, Cotgreave A. [n. d.]. O grande livro de painéis: visualizandoseus dados usando cenários de negócios do mundo real. Wong B. [n. d.]. Codificação de cores. Métodos Nat.
Wu J, Zhao M, Li T, Sun J, Chen Q, Yin C, et al. [n. d.]. HFIP: uma plataformamulti-ômica integra-da de dados e conhecimento para a medicina de precisãoda insuficiência cardíaca. Base de dados.
Xie B, Yuan Z, Yang Y, Sun Z, Zhou S, Fang X. [n. d.]. MOBCdb: um banco dedados abrangente que integra dados multi-ômicos sobre câncer de mama paramedicina de precisão. Yamaguchi J. [n. d.]. Diretrizes para a escolha de técnicas de visualizaçãoaplicadas no processo de aquisição do conhecimento.
Zanfardino M, Castaldo R, Pane K, Affinito O, Aiello M, Salvatore M, et al. [nd.]. MuSA: uma interface gráfica de usuário para integração de dados multiOMICs em estudos radiogenômicos.
Zeng S, Lyu Z, Narisetti SRK, Xu D, Joshi T. [n. d.]. Knowledge Base Commons(KBCommons) v.: uma estrutura universal para integração de dados multiômica e descobertas biológicas.
Zhou G, Ewald J, Xia J. [n. d.]. OmicsAnalyst: uma plataforma abrangentebaseada na web para análise visual de dados multi-ômicos.
Zhu LJ. Ou J. [n. d.]. trackViewer: um pacote Bioconductor para visualizaçãointerativa e integrativa de dados multi-ômicos.
Zoppi J, Guillaume JF, Neunlist M, Chaffron S. [n. d.]. MiBiOmics: umaplicativo da web interativo para exploração e integração de dados multiômicos.