REGISTRO DOI: 10.5281/zenodo.10975177
Vinicius De Souza Santos
Abstract. The global prevalence of diabetes is increasing at an alarming rate, making early and accurate detection a critical area of interest. This study employs Machine Learning techniques to predict the incidence of diabetes in a population of women from the Pima heritage, known for their predisposition to the disease. Using a database of diagnostic measures, multiple algorithms were applied, including Support Vector Machines (SVM), Artificial Neural Networks (ANN), K-Nearest Neighbors (KNN), Decision Trees, and Random Forest, to develop predictive models. Principal Component Analysis (PCA) was implemented for dimensionality reduction and highlighting of key diagnostic variables, optimizing algorithm performance. The results highlighted the superiority of the Random Forest, which showed higher accuracy and precision, suggesting its viability as a clinical diagnostic tool. This study contributes to the emerging field of artificial intelligence applications in health, providing valuable insights for the prevention and early treatment of diabetes.
Keywords: Machine Learning, Diabetes, Principal Component Analysis, Random Forest.Translating your introduction into English while adhering to the formal and academic style:
Introduction
Diabetes has become one of the greatest threats to global health, with its prevalence alarmingly increasing over the past few decades [1] [2]. It is estimated that by 2045, over 700 million people will be affected by the disease, highlighting the urgency to develop effective strategies for its prevention and treatment [3]. Despite advances in medicine, early detection of diabetes remains a significant challenge, and such detection is crucial for preventing severe complications and improving the quality of life for patients, evidencing a critical gap in disease control [4].
In this context, the application of machine learning algorithms emerges as a promising approach to enhance diabetes prediction and diagnosis [5]. These advanced techniques offer the unprecedented capability to analyze vast volumes of clinical data, detecting hidden patterns that may signal the onset of the disease well before symptoms manifest [5]. In particular, this study assesses the effectiveness of different machine learning algorithms, including Artificial Neural Networks, Support Vector Machines, K-Nearest Neighbors, Decision Trees, and Random Forest. The selection of these algorithms was based on their proven efficacy in classification tasks in medical domains according to Paix˜ao et al. (2022)[7], as well as their ability to handle high-dimensional and complex data [7]. The comparative methodology adopted aims not only at evaluating the accuracy of these models but also their generalization capability in different clinical contexts.
However, it is imperative to recognize that, despite their immense potential, machine learning models are not perfect and are susceptible to errors [6]. Cardozo, (2022)[5] addressed that the effectiveness of these algorithms intrinsically depends on the quality of data, the precision of the models, and the appropriateness of the algorithm choice for the specific task at hand. Consequently, this study not only applies these tools but also proposes a methodological framework to continuously enhance their accuracy and reliability. Ongoing research and multidisciplinary collaboration will be key to optimizing the applicability of these algorithms in the healthcare field, ensuring they contribute positively to the early diagnosis and effective management of diabetes[5].
This study distinguishes itself by employing a quantitative research approach, focusing on the direct comparison method with multiple machine learning algorithms to identify the most effective method. The outcomes of this study are expected to have a significant practical impact, offering valuable insights for improving clinical practices in the diagnosis and treatment of diabetes, as well as informing the development of more effective public health policies. The application of machine learning for diabetes diagnosis has the potential to revolutionize how the disease is detected and managed.
Diabetes
Diabetes mellitus, commonly referred to as diabetes, is a chronic metabolic disease characterized by persistent hyperglycemia, i.e., elevated blood glucose (sugar) levels [49]. This condition arises due to a deficiency in the production or action of insulin produced by the pancreas, a hormone essential for glucose metabolism [51]. The specific diagnostic criteria include fasting blood sugar, postprandial glucose tolerance, or random blood sugar levels. Symptoms of diabetes may include excessive thirst, frequent urination, fatigue, and weight loss [50].
However, in the historical and theoretical context of diabetes, it is observed that in the first half of the 20th century, diabetes mellitus manifested in children and adolescents in various ways [52]. A significant portion of patients presented with acute symptoms such as polyuria, polydipsia, dehydration, and ketosis, with rapid deterioration of clinical status, requiring insulin administration to reverse the condition [52]. However, cases were also observed where the disease presented more insidiously and often without ketosis association [53]. These less acute cases, which constituted a minority, did not require insulin therapy for survival in the initial stages of the disease.
There are several types of diabetes, with the most common in medicine being Type 1, Type 2, and gestational diabetes [55]:
- Type 1 Diabetes: An autoimmune condition where the immune system attacks and destroys the beta cells of the pancreas, which are responsible for insulin production. Without sufficient insulin, glucose accumulates in the bloodstream instead of being used as energy. This type usually manifests in childhood and adolescence but can also be diagnosed in adults. Treatment requires insulin administration, dietary planning, and physical activities [55].
- Type 2 Diabetes: In type 2 diabetes, the body exhibits resistance to insulin’s action or does not produce enough insulin to maintain a normal blood glucose level. It is the most common type, which can be managed, in many cases, with physical activities and dietary planning. In other cases, it may require the use of medications or insulin [55].
- Gestational Diabetes: Occurs during pregnancy when there is an increase in blood glucose levels, and the body cannot produce enough insulin to transport all the glucose into the cells, resulting in hyperglycemia. It can cause complications for both mother and baby if not managed properly [55].
In type 1 diabetes, the immune system attacks and destroys the insulin-producing beta cells in the pancreas. In contrast, type 2 diabetes involves a combination of insulin resistance and a relative deficiency in its secretion [55]. Figure 1 illustrates the difference between a healthy individual and someone with type 2 diabetes. In a healthy person, insulin secreted by the pancreas after eating helps glucose enter cells to be used as energy [54]. However, in type 2 diabetes, the body’s cells do not respond properly to insulin (insulin resistance), and glucose cannot effectively enter cells, resulting in hyperglycemia [54]. Figure 1 illustrates this process, showing the insulin receptors not functioning correctly, preventing glucose from entering cells.
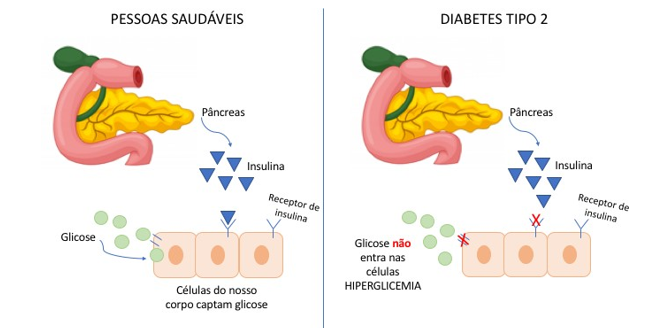
Fig.1. Comparison between glucose uptake in healthy individuals and those with type 2 diabetes, highlighting insulin function and the mechanism of insulin resistance. Source: adapted from [54].
Figure 1 clearly shows the normal functioning of the pancreas and the action of insulin in cells in a person without diabetes, compared with the dysfunction observed in type 2 diabetes, where insulin is not able to facilitate the entry of glucose into cells, leading to hyperglycemia. This understanding is crucial for the treatment, management, prevention, and education about diabetes.
Machine Learning
Machine learning (ML), a critical area of computer science, operates at the confluence of mathematical and statistical techniques with computational algorithms to identify patterns and make predictions [8]. In the medical field, ML advances beyond traditional rule-based expert systems by processing a substantial volume of variables in search of new predictive combinations [8]. The era of big data, characterized by the ”3 Vs” model — large volume, high velocity, and a wide variety of information — challenges traditional data management tools with its enormous volume, high speed, and varied range of information, requiring innovative processing techniques [9].
The process of creating an ML algorithm, illustrated in Figure 2, consists of three phases: preprocessing, training, and evaluation. Initially, data are organized, the research question is formulated, and data are split into training and testing sets [7]. In the training phase, the learning can be supervised, with correctly classified samples, or unsupervised, where the algorithm learns without pre-defined labels [7]. In the final step, the model is tested and evaluated, establishing a mapping standard for the accurate and reliable classification of new data [7].
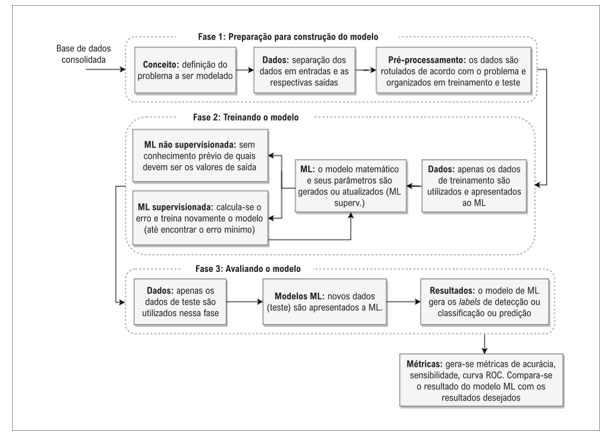
Fig.2. Phases for the development of machine learning algorithms. Source: [7]
It is essential that the development of ML algorithms be conducted on a consolidated and validated database, thus avoiding the generation of spurious results [7]. ML learning, whether supervised or unsupervised, is an iterative process of repeated observations. In supervised learning, the algorithm learns from labeled examples, while in unsupervised learning, the algorithm identifies patterns in the data without pre-defined labels. This process allows the algorithm to generalize information and accurately classify new datasets [7].
Machine Learning Applications in Medicine
Medicine is undergoing a transformation driven by the rapid advancement of machine learning (ML) techniques. The application of these techniques to medical practice has shown potential to revolutionize diagnosis, treatment, and disease prevention [10]. As the amount of data generated in the healthcare sector continues to grow exponentially, ML offers tools to efficiently analyze this data and extract valuable insights [11].
Figure 3 illustrates the increasing trend in the production of scientific literature related to ML in medicine, demonstrating a substantial rise in the number of articles published between 1951 and 2019, as indexed in PubMed and Medline. This growth reflects not only academic interest but also the practical potential of ML in medicine.
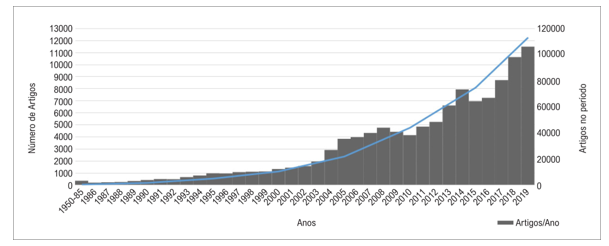
Fig.3. Annual publication count and total cumulative from 1951 to 2019 in the PubMed and Medline databases. Source: [7]
The applications of ML in medicine are vast and varied. They range from clinical decision support systems that assist healthcare professionals in choosing treatments based on patterns found in medical histories [12], to image processing algorithms that improve diagnostic accuracy in radiology [13].
Machine Learning (ML) algorithms have played a crucial role in predicting disease outbreaks, optimizing hospital resources, and developing new drugs. The effectiveness of ML techniques applied to time series and a collection of explanatory variables varies depending on the response variable used. In recent studies, predictions of new daily cases and deaths from Coronavirus in Brazilian cities have utilized characteristics such as temperature, air quality, humidity, and Google searches related to Covid-19 as covariates, combining them with historical information to better predict pandemic trends and direct appropriate interventions [15] [16].
However, despite the advances, the implementation of ML in medicine faces challenges, including the need for large annotated data sets, concerns about data privacy and security, and the importance of results interpretable by health professionals [17].
Therefore, the potential of ML in medicine is evident, but its effective application requires a multidisciplinary and collaborative approach involving physicians, data scientists, engineers, and health policy makers [7]. As we move forward, it is essential that ML tools are validated in clinical settings and align with best medical practices to ensure they complement – rather than replace – human expertise in healthcare delivery.
Machine Learning Techniques
Machine learning (ML) has transformed various areas of research and practical application, notably in the field of medicine, where ML techniques offer new perspectives for personalized diagnoses and treatments [11]. This study focuses on specific ML methods, each with its representative figure, to enhance the prediction and diagnosis of diabetes.
Artificial Neural Networks (ANNs) are inspired by the biological functioning of human neurons and were initially proposed by McCulloch and Pitts in 1943. This model, represented in Figure 4, consists of processing units connected by weighted links, whose weights are adjusted during training. An ANN ’learns’ by adjusting these weights to minimize the model’s prediction error. For instance, a study by Fonseca, Afonso Ueslei, et al. (2023) applied ANNs to identify patterns in medical images, facilitating early disease diagnosis [18].
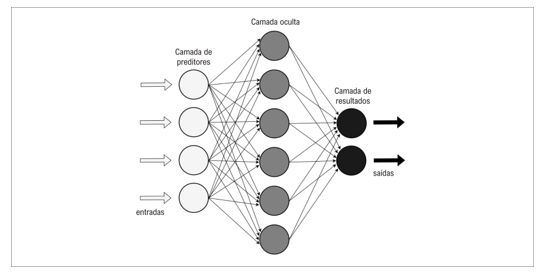
Fig.4. Structure and operation of an artificial neural network. Source: [7]
Support Vector Machines (SVM) are a robust analytical model within machine learning, operating in both classification and regression. This technique, originally developed by Vapnik in 1995 [22], is distinguished by the strategic use of hyperplanes that act as decisive margins in separating classes within a dataset, as demonstrated in the representation of its hyperplane in Figure 5. The effectiveness of SVM lies in maximizing these margins, as intuitively understood that the greater the distance between parallel hyperplanes, the more accurate the model will be in predicting new instances [21].
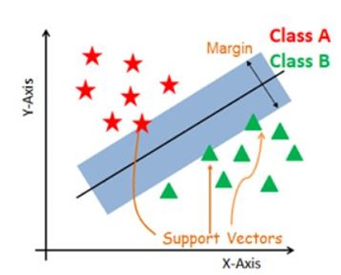
Fig.5. Representation of a hyperplane in a given dataset. Source: [20]
In terms of practical application, a recent study conducted by Costa and Gouveia (2022) [19] exemplifies the potential of SVM in the healthcare area. In this research, SVM was applied to the prediction of Non-Communicable Chronic Diseases (NCDs), achieving a remarkable accuracy of 97%. This result not only underlines the competence of SVM in dealing with complex and high-dimensional data but also reinforces the technique’s relevance in scenarios where precise and reliable decisions are critical for health condition diagnosis and treatment.
The K-Nearest Neighbors (KNN) method is a powerful and intuitive machine learning technique for classification and regression. Proposed by Fix and Hodges in 1951 [24], this non-parametric method assigns the classification of a new example based on the most frequent classes among its k nearest neighbors. In KNN, the k closest data points to the example in question are identified, and classification is performed by majority voting among these neighbors, or, in the case of k=1, the example is simply assigned to the class of its nearest neighbor, as illustrated in Figure 6 below.
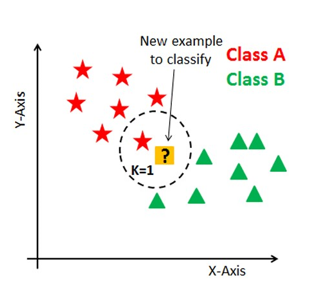
Fig.6. Example of classification with K-Nearest Neighbors (KNN), where k=1 indicates that the new example (marked with a question mark) is classified according to the class of its nearest neighbor. Source: [23]
This method is flexible with respect to the number of neighbors (k), allowing adjustments to improve classification accuracy. KNN has been successfully applied in various medical contexts, as demonstrated by Andr´e Oliveira (2016), who used KNN to classify types of diabetes based on clinical measurements [26]. More recently, KNN was employed with k=3 and the Weighted KNN variant, providing a refined ability to discern complex patterns in health data, which is crucial for implementing precise and personalized diagnoses [23].
Decision Trees, created by J. Ross Quinlan in 1983. Quinlan is also the author of the book ”Machine Learning,” published in 1983, which was one of the first books to present the concept of machine learning [28]. Decision Trees are predictive models that segment the data space into subsets based on logical decisions. A practical example is the work of Carvalho et al. (2015), who used decision trees to create clinical decision support systems for the diagnosis of type 2 diabetes [29].
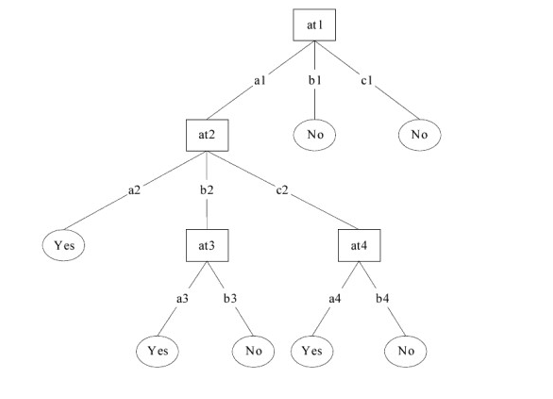
Fig.7. Example of classification with a Decision Tree. Source: [27]
Random Forest, developed by Breiman in 2001, constitutes a significant advance in predictive analysis, particularly in the context of complex data classification. This method operates through the combination of multiple decision trees, each constructed from a random sample of the dataset, with the random selection of variables at each node division [60]. The essence of Random Forest lies in its ability to reduce the risk of overfitting—a common problem in complex machine learning models—while maintaining or even increasing predictive accuracy [60].
A notable aspect of Random Forest is its adaptability to different types of data and problem complexities, making it particularly effective in contexts where the relationships between variables are intricate and difficult to model with simplified linear or parametric approaches [61] [62]. The technique is based on the principle that a large number of relatively uncorrelated models (trees) working together can outperform the performance of any individual model, thus providing a powerful approach for classification and regression tasks [62].
The practical implementation of Random Forest involves training numerous decision trees on varied subsets of the dataset [60]. Each tree makes an independent prediction, and the final classification is determined through majority voting among all trees’ predictions [63]. This aggregation process, known as ”bagging,” contributes to Random Forest’s ability to generalize well to new data, avoiding overfitting while exploiting the diversity of the constituent trees [64].
Various studies have demonstrated the efficacy of Random Forest in a wide range of applications, from disease prediction in medical fields [19] [66] to modeling energy consumption patterns in urban environments, where the complexity and interaction between multiple variables challenge simpler models [65]. Random Forest’s ability to handle large volumes of data, its tolerance for missing data, and the ease of interpreting results contribute to its popularity and applicability across multiple knowledge domains.
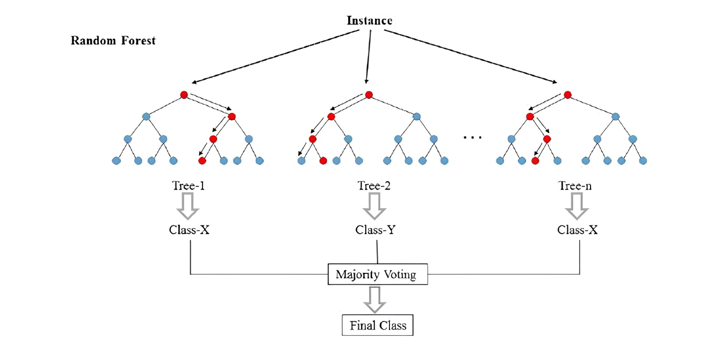
Fig.8. Graphical representation of the functioning of Random Forest. Source: [61]
Figure 8 illustrates the essence of the Random Forest algorithm, emphasizing its collaborative and decentralized structure. Each individual tree in the forest performs an independent evaluation of an instance, based on a random sample of the data and a random subset of variables. The outcome of each tree is a prediction that, when combined through the majority voting process, leads to the final classification provided by the model. This mechanism not only improves prediction accuracy through the diversity and number of trees involved but also mitigates the risk of overfitting, as the likelihood of all trees making the same errors is reduced. The visual representation captures this concept, showing how individual trees contribute to the collective decision, exemplifying the ensemble approach that is central to Random Forest.
Principal Component Analysis (PCA) is a multivariate dimensionality reduction technique, crucial for the processing and analysis of high-dimensional data sets. Initially developed by Karl Pearson in 1901, this technique transforms a set of possible correlated variables into a set of values of linearly uncorrelated variables called principal components [30]. PCA is founded on the orthogonalization of the data space and the maximization of variance, which allows for data compression while retaining most of the original information—a benefit explored in the thesis work of Fernandes (2022) [69].
The first principal component is the direction in the data space that maximizes the variance of the data projections, while subsequent components are orthogonal to the previous ones and maximize the remaining variance. The technique is particularly useful in identifying patterns, eliminating redundancies, and interpreting complex data sets [31].
In the medical field, PCA has been applied for biomarker identification, visualization of complex diseases, and genomic analysis. For example, Porreca et al. (2021) used PCA to investigate the main factors influencing the effects of facial mask use on exercise performance during the COVID-19 pandemic. This application highlights how PCA can play a role in understanding multifactorial phenomena and directing public health measures [32].
Figure 9 associated with PCA typically shows the dispersion of data on the first two principal components, offering a clear visualization of data variability and how different groups can be discriminated based on these projections. The confidence ellipses around the clusters provide a visual understanding of the grouping and the statistical confidence that a sample belongs to a particular group.
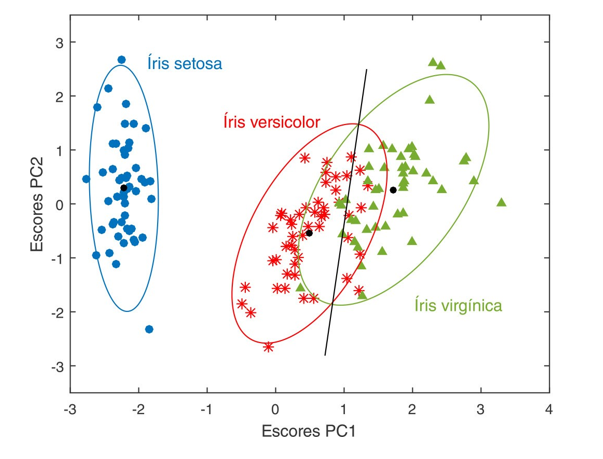
Fig.9. Graphical representation of PCA showing three species of Iris flowers. The black dots indicate the centroids of each group. The ellipses around the samples were drawn with 95% confidence, illustrating PCA’s ability to discriminate between different biological categories. Source: [31]
This type of graphical representation is a powerful tool for initial data exploration, allowing researchers to identify natural groupings, outliers, and trends that may not be immediately apparent in high-dimensional data.
Data Mining, also referred to as Data Mining, constitutes an emerging interdisciplinary field, fueled by exponential growth in the capacity to store and organize massive data [33]. This evolution, stemming from advances in information technology, spurred the development of methods for extracting actionable intelligence from vast data repositories [34]. Thus, data mining is configured as a discipline that congregates statistical methods as demonstrated in Figure 10, machine learning principles, and pattern recognition techniques, to distill meaningful knowledge and discoveries from complex and multidimensional databases [34].
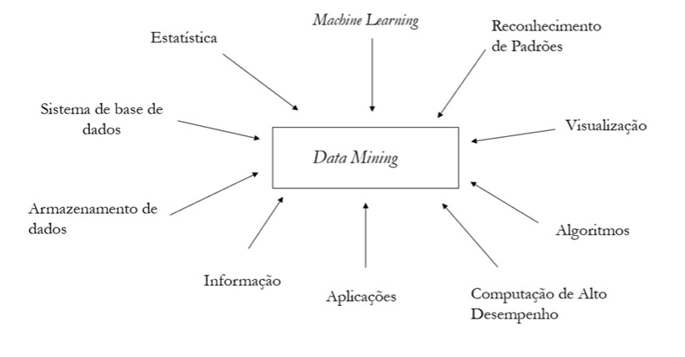
Fig.10. Diversity of Data Mining Source: [33]
Pioneers like Fayyad et al. (1996) coined the term Knowledge Discovery in Databases (KDD) to describe the end-to-end process of knowledge discovery, which starts with raw data and culminates in the use of derived insights for strategic decision-making [35]. The KDD process, consisting of a series of iterative and overlapping steps – including preprocessing, cleaning, integration, selection, transformation, the mining itself, evaluation, and finally, presentation – is outlined in various process models [33]. This model structures data mining as a sequence of logical steps, ensuring methodological rigor and replicability.
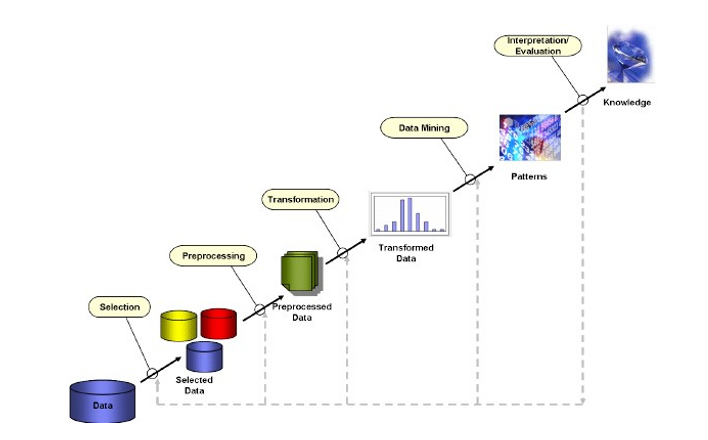
Fig.11. Processes of Knowledge Discovery in Databases (KDD) Source: [36]
Data cleaning, a crucial initial step, deals with incomplete, incorrect, or inconsistent data, preparing the set for subsequent analysis [37]. Techniques such as data imputation, outlier treatment, and normalization are employed to ensure data quality and reliability [37].
Effective data integration seeks consistency and coherence by bringing together information from multiple sources, such as text files, databases, images, and videos. This phase involves detailed data analysis to identify redundancies, dependencies between variables, and value conflicts [37]. After integration, the selection of data relevant to data mining techniques is performed, followed by data treatment, which may include transforming or consolidating the data into the most appropriate format for the data mining process [37]. This treatment may involve the generalization of detailed attributes and the normalization of data to fit within a specific range, as well as the construction of new attributes from existing ones, such as calculating BMI from weight and height variables [40].
In data mining, algorithm evaluation is crucial to ensure the reliability of the results obtained. Evaluation metrics such as accuracy, f1 score, precision, and the confusion matrix serve as key indicators of the performance of classification models [41]. Accuracy is a general measure of performance that calculates the proportion of correct predictions relative to the total number of cases, useful in balanced datasets [41]. The f1 score is a metric that considers both precision (the proportion of correct positive predictions relative to the total number of positive predictions) and recall (the proportion of correct positive predictions relative to the total number of actual positive cases), offering a balance between these two metrics, particularly in situations of class imbalance [42]. The confusion matrix, on the other hand, provides a detailed view of the model’s performance, representing the frequencies of true positives, true negatives, false positives, and false negatives, allowing for a more granular analysis of the type of errors made by the model [43]. These metrics are fundamental for the refinement and selection of models in Data Mining applications, ensuring that predictions are not only accurate but also applicable and interpretable in the context in which they will be used [41].
Supervised and Unsupervised Learning
Supervised and unsupervised learning are the pillars of the machine learning field, each serving distinct purposes and providing valuable insights from data.
In the context of Supervised Learning, the machine is trained with a known dataset, where both inputs and desired outputs are provided, allowing the model to establish a functional relationship between them [45]. Thus, the algorithm learns to map inputs to outputs, facilitating the prediction of results for new, unseen data. This process is described as either a classification or regression method, depending on the nature of the output variable – categorical for classification and continuous for regression [46].
Unsupervised Learning, on the other hand, operates without predefined answers, exploring the intrinsic structure of the input data. Here, the algorithm seeks to discover patterns, clusters, or underlying associations without any intervention or external labels [47]. This type of learning is crucial when the redundancy in the input data allows for the identification of regularities and, consequently, the formation of internal representations that autonomously categorize the data [47][45].
Figure 12 illustrates the diversity of applications and methods within Machine Learning, highlighting the importance of both supervised and unsupervised learning in advancing fields such as computer vision, targeted marketing, and the development of recommendation systems, all essential in the era of Big Data and Artificial Intelligence.
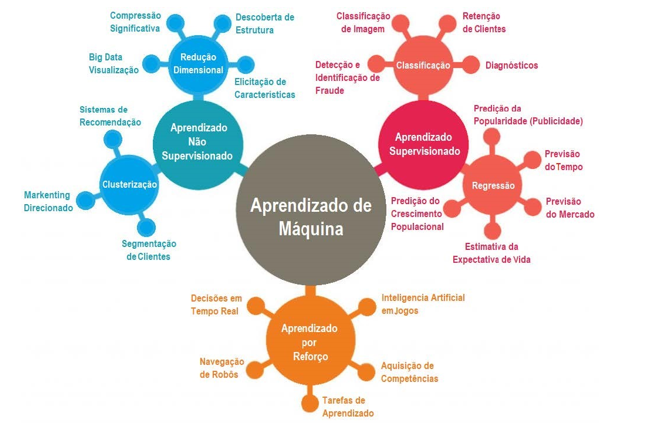
Fig.12. Applications of machine learning algorithms Source: [44].
It is important to note that both approaches have their advantages and limitations, and the choice between supervised and unsupervised often depends on the nature of the problem at hand and the availability and quality of data [44].
For the effective implementation of these techniques, understanding the relationship between data features and desired outcomes is fundamental, as is the ability to translate these relationships into accurate predictive models [48].
Practical Challenges in Implementing Machine Learning in Medicine
The integration of Machine Learning (ML) in the medical field, while promising, faces significant practical challenges that can impact its effectiveness and adoption. These challenges can be grouped into several main categories:
- Data Acquisition and Quality: The efficiency of ML algorithms is directly proportional to the quality and quantity of available data [33]. Obtaining large sets of annotated and reliable medical data is a complex task due to the sensitivity of the data and the need to protect patient privacy.
- Privacy and Data Security: Strict regulations on health data, such as HIPAA in the USA, GDPR in Europe, and LGPD in Brazil, pose significant challenges in using data for ML training without compromising patient privacy [56].
- Model Interpretability: The ’black box’ nature of ML algorithms can be an obstacle in medical practice, where understanding the ’why’ and ’how’ of predictions is crucial for trust and acceptance by healthcare professionals [57].
- Integration into Clinical Workflow: Integrating ML tools into the clinical environment requires an adaptation of the existing workflow, which may face resistance from healthcare professionals due to the learning curve or distrust of new technology [58].
- Variations Among Patients and Conditions: The genetic, behavioral, and environmental diversity of patients means that ML algorithms need to be extremely robust and capable of generalizing well across different subpopulations.
- Multidisciplinary Collaboration: The effectiveness of ML in medicine depends on collaboration between doctors, data scientists, software engineers, and other professionals, which can be challenging due to the different languages and approaches of each discipline.
- Continuous Update and Maintenance: ML models need to be continuously updated with new data to maintain their accuracy, which requires an ongoing commitment of resources and specialized knowledge.
Overcoming these challenges requires a multidisciplinary and collaborative approach, as well as a commitment to continuous education and the adaptation of clinical practices to responsibly and ethically incorporate technological advances.
Materials and Methods
Database
The database used in this study was acquired from the Kaggle repository, (2024), originally from the National Institute of Diabetes and Digestive and Kidney Diseases [59]. The dataset’s objective is to diagnostically predict whether a patient has diabetes, based on specific diagnostic measurements included in the dataset. All patients are female, at least 21 years of age, and of Pima Indian heritage. The database is publicly available under the CC0: Public Domain license [59].
Data Processing and Analysis
Data processing and analysis were essential for preparing the dataset for machine learning algorithms. The adopted methodology for data treatment followed a series of structured steps, ensuring data quality and reliability for subsequent predictive modeling.
Initially, the database, containing relevant medical measurements for diabetes diagnosis, was loaded and read. The database columns include the number of pregnancies, glucose levels, blood pressure, skin thickness, insulin, Body Mass Index (BMI), diabetes pedigree function, age, and the binary outcome indicating the presence or absence of diabetes.
During data loading, the presence of missing values, represented by the character ’?’, was identified. These were treated by replacing them with the average values of their respective columns, a standard statistical method that maintains the original distribution of data without introducing significant bias, as studied by Cardoso (2022) [67].
After correcting missing values, a normalization technique was applied to standardize the data scale. Two normalization approaches were used: Z-score normalization and Min-Max normalization. Z-score normalization transforms data to have a zero mean and one standard deviation, while Min-Max normalization rescales data to a [0, 1] range, where the column’s minimum and maximum values become 0 and 1, respectively. Each normalization approach has its set of advantages and is selected based on the specific requirements of the machine learning algorithm and the nature of the data, as discussed in the study by Maniezzo (2022) [68].
Furthermore, dimensionality reduction was performed using Principal Component Analysis (PCA). PCA is a statistical technique that converts a set of possible correlated variables into a set of values of linearly uncorrelated variables called principal components. This step is crucial as it reduces model complexity without losing significant information, which can improve computational efficiency and prevent the problem of overfitting when training machine learning models.
PCA visualization, through graphs, provided an intuitive understanding of data distribution and separation, allowing a preliminary analysis of how the data might be grouped or classified.
Machine Learning Algorithms Used
The machine learning algorithms used for the classification of medical data include:
- Support Vector Machines (SVM)
- Artificial Neural Networks (ANN)
- K-Nearest Neighbors (KNN)
- Decision Trees
- Random Forest
Before applying these algorithms, the database underwent a preprocessing process to ensure data quality and uniformity. This process included data normalization and splitting the data into a training set and a test set, using a 70:30 ratio, respectively. This approach ensures that the model is trained on a significant portion of the data while keeping a separate portion to test the model’s efficacy on previously unseen data.
After preprocessing, each algorithm was tuned and validated to achieve the best possible performance. Model selection was based on classification accuracy and the clinical relevance of the outcomes. To ensure a comprehensive and fair evaluation of each model, the following metrics were used:
- Accuracy: The proportion of correct predictions relative to the total number of cases.
- Precision: The proportion of correct positive predictions relative to the total number of positive predictions.
- F1-Score: The harmonic mean of precision and recall, providing a balance between these two metrics.
- Confusion Matrix: A table that allows visualization of the algorithm’s performance, including true positives, true negatives, false positives, and false negatives.
The goal of this evaluation is to identify the model that not only shows the highest accuracy but also effectively balances precision and recall capability, crucial for practical application in the medical field.
Support Vector Machines (SVM): An SVM classifier with a linear kernel was instantiated, which is suitable for data that are linearly separable. The gamma parameter was set to ’auto’, meaning the value of gamma is automatically calculated as 1/n features, and the C, which is the regularization parameter, was set to 3.0. A larger C can lead to a model with a smaller margin but may better fit the training data. The random state parameter was configured to ensure reproducibility in the results.
The SVM model was trained using the training dataset X train for attributes and y train for the corresponding labels.
After training, the model was used to make predictions on the test set X test.
The model’s performance was evaluated using various metrics. The accuracy (svm accuracy) provides the fraction of correct predictions, while the F1 Score (svm f1) is the weighted average of precision and sensitivity and provides a measure of precision and recall. The precision (svm precision) measures the proportion of positive identifications that were actually correct, and the confusion matrix (confusion matrix) offers a detailed view of the model’s performance, showing the frequencies of true positives, true negatives, false positives, and false negatives.
This translation maintains the technical detail and clarity of the original text, suitable for an academic and scientific English-speaking audience. If there are more sections you need help translating or specific adjustments required, please let me know.
Artificial Neural Networks (ANN): The application of the Artificial Neural Networks (ANN) algorithm for the classification model in the context of this research followed a systematic approach. The ANN was configured with two hidden layers, each containing 10 neurons, and the training iterated for a maximum of 1000 epochs. The choice of ANN architecture, including the number of hidden layers and neurons, is influenced by empirical considerations and the complexity of the problem under analysis. The selected architecture aims to capture the complexity of the data without incurring overfitting, aligned with the guidelines by Goodfellow et al. (2016) on the depth of neural networks [70].
The ANN was trained using the training set, consisting of the independent variables (X train) and the dependent variable (y train). The fit function of the scikit-learn’s MLPClassifier class was used to fit the model to the data, where the random state was set to ensure the reproducibility of the results.
After training, the ANN was used to make predictions on the test set (X test), resulting in a series of classifications that were compared to the true values (y test). The model’s evaluation was performed using various performance metrics, including accuracy, which measures the proportion of correct predictions; the F1 score (f1 score), which is the weighted average of precision and recall; precision (precision score), which evaluates the accuracy of positive predictions; and the confusion matrix (confusion matrix), which provides a detailed view of the model’s performance in correctly or incorrectly categorizing observations into their respective classes.
The accuracy of the ANN (rna accuracy) reflects the overall ability of the model to correctly classify instances. The F1 score (rna f1) is particularly useful in situations with imbalanced classes, as it takes into account both precision and recall. The weighted precision (rna precision) is calculated taking into account the class balance and is useful for understanding how the model performs on each class individually. The confusion matrix (rna confusion matrix) offers insights into the types of errors made by the model, such as false positives and false negatives.
K-Nearest Neighbors (KNN): For the implementation of the KNN algorithm, we used the Python Scikit-learn library, which offers efficient tools for data analysis and predictive modeling. The KNeighborsClassifier was instantiated with the number of neighbors k set to 1. The chosen distance metric was Minkowski with p=2, corresponding to Euclidean distance, appropriate for our feature space.
The model was trained using the training set X train with the corresponding classes y train. The model fitting was carried out using the fit method, which is the process of training the algorithm with the provided data.
After training, the model was used to make predictions on the test set X test. The predictions were stored in the variable knn predictions. The efficacy of the model was then evaluated by comparing the predictions with the actual values y test from the test set. The metrics used for evaluation included:
- Accuracy (knn accuracy): The proportion of correct predictions from the total predictions made.
- F1-Score (knn
f1): A measure that combines precision and recall. It is the harmonic mean of precision and recall, where an F1-Score achieves its best value at 1 (perfect precision and recall) and worst at 0.
- Precision (knn precision): The proportion of correct positive predictions from the total positive predictions made.
- Confusion Matrix (knn confusion matrix): A table that is often used to describe the performance of a classification model.
The confusion matrix provides valuable insights into the nature of the errors made by the model, allowing to identify if the model is confusing one class with another.
Decision Trees: The Decision Tree was implemented using the DecisionTreeClassifier algorithm from the sklearn.tree library, configured with a ’gini’ criterion to measure the quality of the splits, a min samples split of 2 for the minimum number of samples required to split an internal node, and a max depth of 11, which limits the maximum depth of the tree. The dataset was divided into training and testing subsets, where the model was trained with the training subset using the fit method and the predictions were made on the testing subset.
The performance of the Decision Tree model was evaluated through metrics such as accuracy, F1-Score, and precision, obtained with the functions accuracy score, f1 score, and precision score from the sklearn.metrics library. A confusion matrix was generated with the confusion matrix function to visualize the classifier’s performance in terms of true positives, true negatives, false positives, and false negatives. The confusion matrix provides valuable insights for the interpretation of the model, especially in relation to the balance between sensitivity and specificity.
Random Forest: The implementation and prediction using the Random Forest model were carried out following carefully defined steps for the dataset classification. The model was established based on the RandomForestClassifier from the scikitlearn library, a popular choice due to its effectiveness in handling datasets for classification and regression.
Initially, the Random Forest model was configured with 100 decision trees (n estimators = 100), using ’entropy’ as the criterion for measuring the quality of a split. The random state (random state) was set to 0 to ensure the reproducibility of the model.
The model training was performed with the training set (X train, y train), where the model learned to identify patterns and relationships in the data indicative of the diabetes diagnostic outcome.
After training, the model was used to make predictions on the test set (X test), resulting in a vector of predictions (rf predictions).
For evaluating the performance of the Random Forest model, various statistical metrics were calculated to provide an assessment of the Random Forest model:
- The accuracy (rf accuracy) measured the proportion of correct predictions relative to all predictions made, providing an overview of the model’s effectiveness.
- The F1-score (rf f1) provided a measure of precision testing, combining precision and recall into a single metric, which is particularly useful when the classes are imbalanced.
- The precision (rf precision) evaluated the accuracy of the positive predictions made by the model.
- The confusion matrix (rf confusion
matrix) offered a detailed view of the model’s performance, indicating where the model is confusing the classes.
Ethical Considerations
Although the data are publicly available and do not contain personally identifiable information, all recommended practices for research ethics were followed. This includes the anonymization of any potentially identifiable information and confirmation that the use of the data is in compliance with the terms of use established by the Kaggle repository and relevant data regulations.
Limitations
The limitations of the study include the specificity of the dataset’s population (women of Pima heritage aged 21 or older) which may not be generalizable to other populations. Furthermore, the quality of the data and the representativeness of the variables may influence the outcomes of the machine learning algorithms. Other constraints must be considered when interpreting the results of this study. The database used does not distinguish between different types of diabetes (type 1, type 2, and gestational) in positive cases, labeling them generically as positive for the disease. This absence of differentiation prevents a more in-depth analysis that could lead to specific insights for each type of diabetes and their physiological and epidemiological nuances.
Another significant limitation is the number of instances in the database, which comprises 768 cases. This sample size, although sufficient to perform a preliminary analysis and develop predictive models, may not be large enough to capture all the heterogeneity and complexity associated with the diabetic condition. The limited volume of data could affect the machine learning algorithms’ ability to generalize their predictions to a broader population, potentially reducing the practical applicability and accuracy of the conclusions drawn from this study.
These limitations highlight the need for caution in generalizing the results obtained and suggest the importance of future studies that include more comprehensive and detailed datasets. Such studies should allow distinction between different types of diabetes and consider a more representative sample of the general population.
Results and Discussion
This section discusses the results obtained from the application of machine learning algorithms in predicting diabetes and explores the impact of missing values and the contribution of Principal Component Analysis (PCA).
Impact of Missing Value Imputation on Predictive Analysis
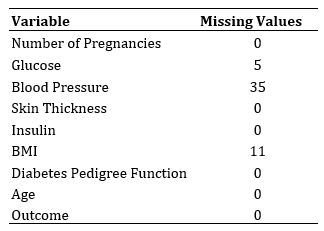
The imputation of missing values is a critical step in preparing data for predictive analysis. In the present study, important variables such as BMI, Glucose, and Blood Pressure contained missing values represented by ’?’, as indicated in Table 1. These data were imputed with the mean of the corresponding variable, a traditional approach aimed at minimizing the impact on the overall distribution of the data.
The decision to use the mean for imputation was based on the premise that the missing data are MCAR (Missing Completely At Random). However, this assumption may not always hold, and its application should be approached with caution. Although this technique is efficient and easy to implement, it can lead to an underestimation of variability and potential biases in model estimation, especially if the mechanism of missing data is related to the missing variable itself.
The model evaluation considered the potential influence of imputation on predictive accuracy, with additional analyses conducted to validate the imputation. The analysis of the results indicated that, despite the imputation, the models maintained adequate performance, suggesting that the imputation strategy employed did not introduce a significant bias that adversely affected the predictive capability of the models in this specific context.
Table 1. Summary of Missing Values
Interpretation of PCA
Principal Component Analysis (PCA) was applied to reduce the dimensionality of the dataset and identify the most significant variables contributing to the variation in data from patients with and without diabetes. Figure 13 illustrates the projection of the data onto two principal components. It is observed that patients are distinctly grouped along the First Principal Component, which suggests that this axis captures a significant variation related to the diabetes state.
The minimal overlap between the groups in Figure 13 indicates that the PCA model managed to extract relevant features differentiating diabetic patients from non-diabetic ones. This result justifies the use of PCA as a preliminary step in predictive analysis, as it provides a simplification of the feature space while retaining the most relevant information for classification.
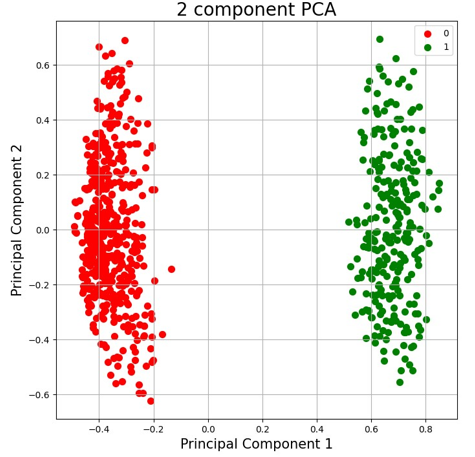
Fig.13. Distribution of data across the two main components of PCA, demonstrating the separation between patients with and without diabetes (0: without diabetes, 1: with diabetes).
The interpretation of the principal components in relation to the original variables is an essential subsequent step. While the First Principal Component may be associated with factors such as glucose levels and BMI, the Second Principal Component might represent other clinical variables. Future analyses could focus on the loading of each variable on the principal components to better understand how each feature contributes to the diabetes condition.
Comparison of Classifier Performance
The comparative evaluation of classifiers revealed notable variations in their performance, as demonstrated in Table 2. Random Forest emerged as the most accurate model, achieving the highest scores across all metrics considered. Specifically, an accuracy of 0.86, F1-Score of 0.86, and precision of 0.87 suggest a higher reliability of this algorithm in correctly classifying patients. Artificial Neural Networks also showed robust performance, with consistent scores of 0.81 in accuracy, F1-Score, and precision, indicating their ability to model the complexities of the dataset.
Table 2. Comparison of performance of different classifiers

These results indicate that more complex methods capable of capturing nonlinear interactions among variables, such as Random Forest, may be more suitable for this type of medical data analysis. However, it is important to note that the choice of classifier should not be based solely on performance metrics but should also consider the model’s interpretability and the clinical context in which it will be applied.
Interpretation of Confusion Matrices
The confusion matrices for each classifier were analyzed to assess their ability to correctly identify cases of diabetes. As illustrated in the tables (3, 4, 5, 6, and 7) below, the Random Forest classifier exhibited a lower incidence of false negatives, highlighting its efficiency in recognizing positive cases of the disease. This is a significant result, as in medical practice, minimizing false negatives is crucial to ensure that patients receive the necessary treatment.
Table 3. Confusion Matrix – KNN
Non-Diabetic (0) Diabetic (1) Predicted Non-Diabetic (0) 111 45 Predicted Diabetic (1) 30 114
Table 4. Confusion Matrix – SVM
Non-Diabetic (0) Diabetic (1) Predicted Non-Diabetic (0) 127 29 Predicted Diabetic (1) 36 108
Table 5. Confusion Matrix – ANN
Non-Diabetic (0) Diabetic (1) Predicted Non-Diabetic (0) 125 31 Predicted Diabetic (1) 25 119
Table 6. Confusion Matrix – Decision Tree
Non-Diabetic (0) Diabetic (1) Predicted Non-Diabetic (0) 114 42 Predicted Diabetic (1) 19 125
Table 7. Confusion Matrix – Random Forest
Non-Diabetic (0) Diabetic (1) Predicted Non-Diabetic (0) 123 33 Predicted Diabetic (1) 10 134
The KNN classifier exhibited a relatively good balance between true positives and true negatives, while the SVM and Decision Tree tended to classify more cases as negative, as indicated by the higher number of false negatives. In contrast, the ANN demonstrated an effective compromise between sensitivity and specificity, as evidenced by the proportion of true positives and true negatives.
The detailed analysis of the confusion matrices suggests that Random Forest may be more suitable for diagnosing diabetes in the dataset studied, providing a basis for algorithm selection in future clinical implementations.
General Considerations
The selection of an appropriate classifier for medical diagnosis must balance accuracy and sensitivity. Models should minimize both false positives, which can lead to unnecessary medical procedures, and false negatives, which can result in delays in treatment. In this study, Random Forest stood out, suggesting its viability for diabetes detection. Beyond statistical performance, clarity in interpreting results is essential, reinforcing the value of explainable algorithms in medical practice, where data-driven decisions must be transparent and justifiable.
Conclusion
This investigation has revealed that while the selection of a classifier for diabetes prediction should be informed by performance metrics, clinical applicability and the interpretability of results are equally crucial. Random Forest, standing out in statistical criteria, is suggested as a robust option due to its capacity to minimize false negatives, which is vital to ensure the appropriate identification of patients requiring intervention. The inclusion of PCA as part of the predictive modeling process was validated, contributing to a deeper understanding of influential characteristics and supporting the selection of relevant features for future iterations of prediction models. This study underscores the importance of a holistic approach in predictive health analysis, prioritizing not just accuracy but also clinical usability and transparency in medical decision-making.
References
- de Oliveira Santos, Givanildo, et al. ”Exerc´ıcios f´ısicos e diabetes mellitus: Revisa˜o.” BrazilianJournal of Development, vol. 7, no. 1, 2021, pp. 8837-8847.
- da Silva, Maria Eduarda, et al. ”Promoc¸a˜o da homeostase glicˆemica em indiv´ıduos diab´eticosatrav´es do exerc´ıcio f´ısico: Uma revisa˜o narrativa.” Brazilian Journal of Development, vol. 6, no. 7, 2020, pp. 44576-44585.
- WHITING, David R. et al. ”IDF diabetes atlas: global estimates of the prevalence of diabetesfor 2011 and 2030.” Diabetes research and clinical practice, vol. 94, no. 3, 2011, pp. 311-321.
- Mendes, Alana Caroline Alves, et al. ”Promoc¸a˜o em sau´de para condutas de ha´bitos sauda´veispara reduc¸a˜o de diabetes tipo II e hipertensa˜o na atenc¸a˜o prima´ria.” Revista JRG de Estudos Acadˆemicos, vol. 6, no. 13, 2023, pp. 1773-1792.
- Cardozo, Glauco. ”Um modelo computacional utilizando t´ecnicas de machine learning e exameslaboratoriais de rotina na triagem e apoio ao diagno´stico de diabetes mellitus.” 2022.
- Monteiro, Rosangela, et al. ”INTELIGENCIA ARTIFICIAL, DEEP LEARNING, MACHINEˆ LEARNING, REDES NEURAIS NA MEDICINA E BIOMARCADORES VOCAIS: CONCEITOS, ONDE ESTAMOS E PARA ONDE VAMOS.” Rev Soc Cardiol Estado de Sa˜o Paulo, vol. 32, no. 1, 2022, pp. 11-17.
- Paixa˜o, Gabriela Miana de Mattos, et al. ”Machine Learning na Medicina: Revisa˜o e Aplicabilidade.” Arquivos Brasileiros de Cardiologia, vol. 118, 2022, pp. 95-102.
- Surden, Harry, Tourinho Leal, Saul, e Silva Neto, Wilson Seraine da. ”Machine learning e odireito.” Suprema-Revista de Estudos Constitucionais, vol. 3, no. 1, 2023, pp. 353-389.
- Ramos, Ma´ıra Catharina, et al. ”Big Data e Inteligˆencia Artificial para pesquisa translacionalna Covid-19: revisa˜o ra´pida.” Sau´de em Debate, vol. 46, 2023, pp. 1202-1214.
- Dias, Caio Eduardo, Saqui, Diego, e Moreira, Heber Rocha. ”Desenvolvimento de um aplicativo para classificac¸a˜o de doenc¸as e pragas em folhas de caf´e utilizando deep learning.” 15º JORNADA CIENT´IFICA E TECNOLOGICA E 12´ º SIMPOSIO DE P´ OS-GRADUAC¸´ AO DO˜ IFSULDEMINAS, vol. 15, no. 3, 2023.
- Souza, Ewerton Pacheco de, et al. ”Aplicac¸o˜es do Deep Learning para diagno´stico de doenc¸ase identificac¸a˜o de insetos vetores.” Sau´de em Debate, vol. 43, 2020, pp. 147-154.
- Vitoria, Sergio Ricardo Pacheco da. ”Machine learning e ana´lise preditiva em sau´de: um estudode caso sobre detecc¸a˜o de anomalias em contas m´edicas do Exercito.” 2022.
- Souza, Amanda Cristina Eleut´erio, and Saqui, Diego. ”METODO DE PR´ E-DIAGN´ OSTICO´ DA COVID-19 E PNEUMONIA UTILIZANDO IMAGENS DE RADIOGRAFIA DO TORAX´ E CNN.” 15º JORNADA CIENT´IFICA E TECNOLOGICA E 12´ º SIMPOSIO DE P´ OS-´ GRADUAC¸AO DO IFSULDEMINAS, vol. 15, no. 3, 2023.˜
- Santos, Jefferson Pacheco dos. ”Proposta de um sistema para avalia¸ca˜o de riscos de infecc¸a˜odo s´ıtio ciru´rgico utilizando t´ecnicas de inteligˆencia artificial.” 2021.
- Medeiros et al. ”Short-term COVID-19 forecast for latecomers.” arXiv preprint arXiv:2004.07977, 2020.
- Vaishya, R., Javaid, M., Khan, I. H., e Haleem, A. ”Artificial intelligence (AI) applicationsfor COVID-19 pandemic.” Diabetes and Metabolic Syndrome: Clinical Research and Reviews, 2020.
- Stakoviak, Flavio Henrique Moura. ”Inovac¸a˜o em acesso a` informa¸ca˜o em biotecnologia: desenvolvimento de um mecanismo de busca inteligente baseado em processamento de linguagem natural.” 2023.
- Fonseca, Afonso Ueslei, et al. ”Diagnosticando Tuberculose com Redes Neurais Artificiais eRecursos BPPC.” Journal of Health Informatics, vol. 15, Edic¸a˜o Especial, 2023.
- Costa, Oberdan, and Gouveia, L. ”Uma proposta para um Sistema Inteligente de Previsa˜o doRisco de Doenc¸as Croˆnicas.” In GASPAR, J. et al., eds. Sistemas Inteligentes para a Sau´de: desafios da ´etica e governanc¸a. Anais do CBIS, 2022, pp. 243-248.
- DataCamp. ”Support Vector Machines with Scikit-learn.” Acessado em 02 de marc¸o de 2024. https://www.datacamp.com/community/tutorials/.
- Veiga, D. M., & Ferreira, D. ”Sera´ Poss´ıvel Melhorar O Diagno´stico Da Icter´ıcia Neonatal?Aplicac¸a˜o De T´ecnicas De Data Mining.” 2011.
- Boswell, Dustin. ”Introduction to support vector machines.” Departamento de Ciˆencia daComputac¸a˜o e Engenharia, Universidade da Califo´rnia, San Diego, vol. 11, 2002.
- Teixeira, Pedro Miguel Bento. ”Classificac¸a˜o automa´tica de termogramas do p´e diab´eticousando t´ecnicas de Machine Learning.” 2021.
- Fix, E. and Hodges, J.L. ”Discriminatory Analysis, Nonparametric Discrimination: Consistency Properties.” Technical Report 4, USAF School of Aviation Medicine, Randolph Field, 1951.
- Urso, A., Fiannaca, A., La Rosa, M., Rav`ı, V., Rizzo, R. ”Data mining: Prediction methods.” In: Encyclopaedia of Bioinformatics and Computational Biology: ABC of Bioinformatics,Elsevier, 2018, pp. 413–430. https://doi.org/10.1016/B978-0-12-809633-8.20462-7.
- Olivera, Andr´e Rodrigues. ”Comparac¸a˜o de algoritmos de aprendizagem de ma´quina paraconstruc¸a˜o de modelos preditivos de diabetes na˜o diagnosticado.” 2016.
- Maglogiannis, Ilias G., ed. ”Emerging artificial intelligence applications in computer engineering: real world AI systems with applications in eHealth, HCI, information retrieval and pervasive technologies.” Vol. 160. IOS Press, 2007.
- QUILAN, J. Ross. ”C4.5: Programs for Machine Learning.” San Mateo, CA: Morgan Kaufmann Publishers, 1993. 312 p.
- Carvalho, Deborah Ribeiro, Dallagassa, Marcelo Rosano, e da Silva, Sandra Honorato. ”Usode t´ecnicas de minerac¸a˜o de dados para a identificac¸a˜o automa´tica de beneficia´rios propensos ao diabetes mellitus tipo 2.” Informac¸a˜o & Informac¸a˜o, vol. 20, no. 3, 2015, pp. 274-296.
- Pearson, Karl. ”LIII. On lines and planes of closest fit to systems of points in space.” TheLondon, Edinburgh, and Dublin Philosophical Magazine and Journal of Science, vol. 2, no. 11, 1901, pp. 559-572.
- Ferreira, Ma´rcia Miguel Castro. ”Quimiometria III-Revisitando a ana´lise explorato´ria dosdados multivariados.” Qu´ımica Nova, vol. 45, 2023, pp. 1251-1264.
- Porreca, Paloma Priscila, et al. ”Efeitos do uso da ma´scara facial no exerc´ıcio durante apandemia da covid-19: uma an´alise de componente principal (PCA).” Biolo´gicas And Sau´de, vol. 11, no. 38, 2021, pp. 13-14.
- dos Santos Nunes, Florbela. ”Previsa˜o de nu´mero de dias de internamento em doentesdiab´eticos-Uma abordagem de Machine Learning.” 2020.
- Galvao, Noemi Dreyer, and Marin, Heimar de Fa´tima. ”Tecnica de mineraca˜o de dados: umarevisa˜o da literatura.” Acta Paulista de Enfermagem, vol. 22, 2009, pp. 686-690.
- Fayyad, Usama; Piatetski-Shapiro, Gregory; Smyth, Padhraic. ”The KDD Process for Extracting Useful Knowledge from Volumes of Data.” In: Communications of the ACM, Nov. 1996, pp. 27-34.
- Guerra-Herna´ndez, Alejandro, Mondrago´n-Becerra, Rosbelda, and Cruz-Ram´ırez, Nicandro.”Explorations of the BDI Multi-agent support for the Knowledge Discovery in Databases Process.” Research in Computing Science, vol. 39, 2008, pp. 221-238.
- Oliveira, Paulo, Rodrigues, Fa´tima, and Henriques, P. ”Limpeza de dados: Uma visa˜o geral.”Data Gadgets, 2004, pp. 39-51.
- da Costa Coˆrtes, S´ergio, Porcaro, Rosa Maria, and Lifschitz, S´ergio. ”Minerac¸a˜o de dadosfuncionalidades, t´ecnicas e abordagens.” PUC, 2002.
- Rigo, Sandro Jos´e, et al. ”Aplicac¸o˜es de Minerac¸a˜o de Dados Educacionais e Learning Analyticscom foco na evasa˜o escolar: oportunidades e desafios.” Revista Brasileira de Informa´tica na Educac¸a˜o, vol. 22, no. 01, 2014, p. 132.
- Mello, Joa˜o Alexandre Bonin de. ”Uma proposta de modelo de dados para suporte ao processamento transacional e de data warehouse simultaneamente.” 2002.
- Junior, Guanis B. Vilela, et al. ”M´etricas utilizadas para avaliar a eficiˆencia de classificadoresem algoritmos inteligentes.” Revista CPAQV–Centro de Pesquisas Avanc¸adas em Qualidade de Vida, vol. 14.2, 2022, p. 2.
- Milani, Anna, et al. ”A Deep Learning Application for Psoriasis Detection.” Anais do XXEncontro Nacional de Inteligˆencia Artificial e Computacional, SBC, 2023.
- Souza, Emanuel G. ”Entendendo o que ´e Matriz de Confusa˜o com Python – DataHackers – Medium.” Medium, 2019. Dispon´ıvel em: https://medium.com/data-hackers/ entendendo-o-que-%C3%A9-matriz-de-confus%C3%A3o-com-python-114e683ec509. Acesso em: 2 mar. 2024.
- Clavera, Walter. ”Aprendizado de Ma´quina (Machine Learning).” SEJATECH e FALETECH, 2019. Dispon´ıvel em: https://www.redesdesaude.com.br/ aprendizado-de-maquina-machine-learning/. Acesso em: 2 mar. 2024.
- Dijkinga, Fernando Jean. ”Utilizac¸˜ao de aprendizagem supervisionada de ma´quina parapredic¸a˜o de valores gen´eticos com base em duas gerac¸o˜es de ascendentes.” Research, Society and Development, vol. 12, no. 6, 2023, e2812641904-e2812641904.
- Fernandes, Fernando Timoteo, and Chiavegatto Filho, Alexandre Dias Porto. ”Perspectivasdo uso de minera¸ca˜o de dados e aprendizado de ma´quina em sau´de e seguranc¸a no trabalho.” Revista Brasileira de Sau´de Ocupacional, vol. 44, 2019, e13.
- Fernandes, Fernando Timoteo. ”Machine learning em sau´de e seguranc¸a do trabalhador: perspectivas, desafios e aplicac¸o˜es.” Dissertac¸a˜o de Mestrado, Universidade de Sa˜o Paulo, 2021.
- Oliveira, David Fernandes Neves. ”Interpretabilidade de modelos de aprendizado profundoaplicados ao diagno´stico e progno´stico na˜o supervisionado de falhas.” Dissertac¸a˜o de Mestrado, Universidade de S˜ao Paulo, 2022.
- SANCHES, Jonas Rodrigues. ”Ana´lise comparativa dos efeitos morfofuncionais e ultraestruturais dos diabetes mellitus tipo 1 e diabetes mellitus tipo 2 no f´ıgado de ratos.” 2023.
- Giroldo, Julio Cesar, and Gabriel, Anderson Luiz. ”Diabetes mellitus tipo 2: a intervenc¸a˜oda atividade f´ısica como forma de aux´ılio e qualidade de vida.” Revista Carioca de Educac¸˜ao F´ısica, vol. 15, no. 1, 2020, pp. 28-39.
- Silva, Tha´ıza Morais da. ”Revisa˜o bibliogra´fica sobre o diagno´stico e o tratamento do diabetesmellitus.” 2019.
- Costa, Fabrycianne Gonc¸alves. ”Bem-estar subjetivo, resiliˆencia e representac¸o˜es sociais nocontexto do diabetes mellitus.” 2017.
- Waldman, Beatriz Ferreira. ”Envelhecimento bem-sucedido: uma metodologia de cuidado apessoas com diabetes mellitus.” 2006.
- OCRC, CEPID. ”A relac¸a˜o entre Diabetes tipo 2 e a maior gravidade da COVID-19: o que sabemos?” Sobre Peso — Dicas e segredos para manter o peso sob controle! 2020. Dispon´ıvel em: https://www.sobrepeso.com.br/ a-relacao-entre-diabetes-tipo-2-e-a-maior-gravidade-da-covid-19-o-que-sabemos/. Acesso em: 2 mar. 2024.
- SBD. ”Tipos de Diabetes – Sociedade Brasileira de Diabetes.” Sociedade Brasileira de Diabetes,2024. Dispon´ıvel em: https://diabetes.org.br/tipos-de-diabetes/#:~:text=Cerca%20de%2090%25%20das%20pessoas,atividade%20f%C3%ADsica%20e%20planejamento%20alimentar.. Acesso em: 2 mar. 2024.
- Dadamos, Fernando Magalha˜es. ”Fatores cr´ıticos de sucesso para adoc¸a˜o da LGPD nas empresas brasileiras: um estudo Delphi com especialistas.” Dissertac¸a˜o de Mestrado, 2022.
- Vidal, Maciel Calebe, and Machado, Arthur Cisotto. ”Inteligˆencia Artificial Explica´vel (XAI) na a´rea m´edica.” 2023.
- SaudeBusiness. ”Como vencer a resistˆencia tecnolo´gica em m´edicos e pacientes.” saudebusiness.com, 2021. Dispon´ıvel em: https://www.saudebusiness.com/ti-e-inova%C3%A7%C3%A3o/ como-vencer-resist%C3%AAncia-tecnol%C3%B3gica-em-m%C3%A9dicos-e-pacientes. Acesso em: 2 mar. 2024.
- Chauhan, Aman. ”Predict Diabetes.” Kaggle.com, 2023. Dispon´ıvel em: https://www.kaggle.com/datasets/whenamancodes/predict-diabities/data. Acesso em: 2 mar. 2024.
- Breiman, Leo. ”Random forests.” Machine Learning, vol. 45, 2001, pp. 5–32.
- Junior, ICMC. ”Random Forest — Entenda Agora Esse Algoritmo Poderoso.” 2021. Dispon´ıvelem: https://icmcjunior.com.br/random-forest. Acessado em 16 de dezembro de 2023.
- de Alvarenga Ju´nior, Wagner Jos´e. ”M´etodos de otimizac¸a˜o hiperparam´etrica: um estudocomparativo utilizando a´rvores de decisa˜o e florestas aleato´rias na classificac¸a˜o bina´ria.” 2018.
- Ribeiro, Eduardo, et al. ”Modelo preditivo para a proliferac¸˜ao do Aedes aegypti em Itaja´ı(Santa Catarina): Uma abordagem integrando fatores clima´ticos locais e globais.” Estraba˜o, vol. 5, 2024, pp. 81-91.
- Santos, Andraws Steve. ”Modelos de machine learning para identificac¸a˜o de clientes com riscoacrescido de branqueamento de capitais e financiamento do terrorismo.” 2023.
- Santos, J. A. A. and Chaucoski, Y. ”Previsa˜o do consumo de energia el´etrica na regia˜o sudeste: um estudo de caso usando sarima e lstm.” Revista Cereus, vol. 12, no. 4, 2020, pp. 93–104.
- Rodrigues, Gustavo, and Kreutz, Diego. ”Modelo preditivo para classifica¸ca˜o de risco de o´bitode pacientes com COVID-19 utilizando dados abertos.” Anais do XXII Simpo´sio Brasileiro de Computac¸a˜o Aplicada a` Sau´de, SBC, 2022.
- Cardoso, Isaac. ”T´ecnicas de otimizac¸a˜o e m´etricas de avaliac¸a˜o aplicadas a machine learning.”2022.
- Maniezzo, Giovanni Vallim, Oliveira, Jorge Luiz Arantes de, e Pereira, Maria Eduarda Riskalla.”Processamento e classificac¸a˜o de sinais de EEG por meio de machine learning para identificac¸a˜o de emo¸co˜es ba´sicas. 2022.”
- Fernandes, Lucinara Kecia Silva. ”Aprendizagem de ma´quina para previsa˜o de predisposic¸˜aoao medo do crime.” 2022.
- Goodfellow, I., Bengio, Y., e Courville, A. ”Deep Learning.” MIT Press, 2016. Disponível em:http://www.deeplearningbook.org. Acesso em: 3 mar. 2024.
Department of Computer Engineering, Federal Institute of Education,Science, and Technology of SãoPaulo (IFSP) – Campus Birigui, Brazil.E-mail: vinicius.santos@ifsp.edu.br
