REGISTRO DOI: 10.69849/revistaft/th10248161346
Viviane Soares1
Matias Noll2
Patrícia Espíndola Mota Venâncio3
Ivan Silveira de Avelar4
Abstract
Introduction: Dehydration is a process that occurs during moderate-to-vigorous exercise and depends on the volume, intensity, time of exercise, drinking behavior, and level of training. Methods: In the present study, we evaluated the hydration level of 25 participants who hiked for five days (296 km) by using bioimpedance analysis (BIA), and bioimpedance vector analysis (BIVA). Male participants were weighed and submitted to BIA with a tetrapolar electrode system at a frequency of 50 kHz in the morning and afternoon during the five-day hike. The variations of BIA, BIVA, and percentage of dehydration were calculated and their differences during the five days were compared. Results: Eighteen participants had a BM loss ≥ 1.9% on the first day. BIA and BIVA showed positive variation, indicating dehydration at the end of the first day. On the succeeding four days, the variation was negative, indicating that the participants finished the day hydrated, but started the day dehydrated. Individual vectors plotted in the tolerance ellipse plot indicated dehydration on the first two days, normalization of hydration on the third day (ellipse of 75% tolerance), and hyperhydration on the last two days.Conclusion: BIA and BIVA showed positive variation, indicating dehydration at the end of the first day, but on the succeeding four days, the variation was negative, indicating hydrated at the end of the day, but were started dehydrated. Individual vectors plotted in the tolerance ellipse plot indicated dehydration on the first two days, normalization of hydration on the third day (ellipse of 75% tolerance), and hyperhydration on the last two days.
INTRODUCTION
In the central region of Brazil, one of the largest environmental projects in Latin America is held each year to raise public awareness on the preservation of the fauna and flora of the largest biome in the world. The ecological hike (Ecological Walk) lasts for five days, and participants travel from Trindade to the city of Aruanã-GO on an average of 59 km/day. To accomplish the route, many times they run. Water replenishment of these participants is performed ad libitum throughout the course, with no water loss and water replenishment monitoring. As inadequate water replenishment during a few hours of moderate-to-vigorous physical activity leads to cardiovascular and muscular changes (Castillo-Martínez et al., 2012b; Logan-Sprenger et al., 2015). And, hiking for an entire day (mean of 8.3 hours) for five days with temperatures between 31 and 42°C can most likely lead to dehydration and chances of cardiovascular events.
The main hydration evaluation parameter in these situations is the loss of body mass defined as the loss of 2% of body weight (BW) during moderate-to-vigorous physical exercise (Sawka et al., 2007). Recently has been shown that variation in body mass loss could not be considered equal to water loss (loss of body mass = loss of body water) during long-term exercise (Cheuvront & Montain, 2017). It is necessary to consider, also, the water loss that occurs during the oxidation of substrates during exercise, mainly glycogen (Cheuvront & Montain, 2017; Hoffman, Goulet & Maughan, 2018).
However, bioelectrical impedance (BIA) and bioimpedance vector analysis (BIVA) are tools that can be used to monitor changes that occur in conditions of extreme cellular metabolism such as long-distance walking. The BIA can estimate total body water (TBW), extracellular (EW), and intracellular water (IW) using the parameters resistance (R), reactance (Xc), and phase angle (PA) in regression equations (Eickemberg et al., 2011). But, equations validated in the literature may over-or underestimate body fluids due to different clinical conditions, the ethnicity of groups, and age that may compromise the assessment of hydration (Kyle et al., 2004). BIVA supplemented and reduced the limitations of the BIA and provided a qualitative assessment of hydration and cell mass by constructing the R/Xc graph using the resistance and reactance normalized by height (Piccoli et al., 1994). The length of the vectors, the confidence, and tolerance ellipses are the keys to interpretation. The vectors positioned at the center of the ellipse suggest normohydration, whereas the longer vector characterizes dehydration (greater resistance in the passage of electric current) and the short vector indicates hyperhydration (lower resistance) (Khalil, Mohktar & Ibrahim, 2014; Abbas, Zhu & Levin, 2015).
The BIVA is useful as an important tool to verify the hydration status and the cellular mass, so it has been used as prognosis in clinical conditions, such as chronic renal failure, patients undergoing hemodialysis, heart failure, some cancers, anorexia nervosa, and weights (Castillo-Martínez et al., 2012a; Haas et al., 2012; Lukaski & Piccoli, 2012; Malecka-Massalska et al., 2012; Soares et al., 2013).
Even receiving water ad libitum there are chances of dehydration by followed days of hiking with moderate to vigorous load, time exceeding 5 hours, and at elevated temperatures how to happen in hiking. In the present study, we hypothesized that participants would exhibit changes in the markers of bioimpedance analysis (BIA) and vectors position related to bioimpedance vector analysis (BIVA). Thus, the aim was to monitor the hydration of the participants of a 296-km ecological hike for five days using BIA and BIVA.
Materials & Methods
Participants
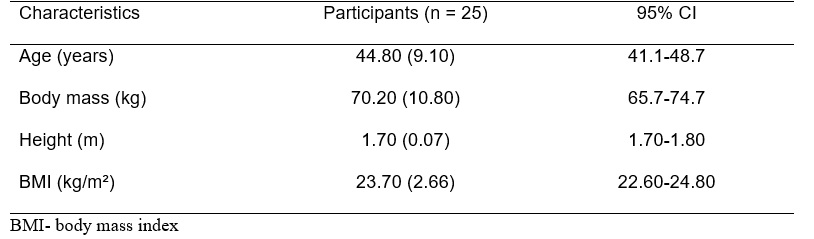
This observational study was carried out during an endurance tour called Ecological Walk in the Midwest region of Brazil. The tour is funded by the state government and has been held yearly since 1990. Participant recruitment started two months before the event by a team from the State Secretary of Education of the State of Goiás. Participants were included upon presentation of their medical clearance and everyone exercised regularly. Participant selection was performed on two consecutive days in which they were required to hike at least 28.2 km in 3 hours and 10 minutes. Seventy-one participants were enrolled, but 20 were eliminated on the first day and 24 on the second day. Finally, 25 participants remained (Table 1). Participants who exceeded the target pace and distance were automatically excluded. Following the selection, participants underwent clinical tests to assess their health conditions. The study was approved by the Research Ethics Committee of the Federal University of Goiás (Approval no. 781/2013). The procedures involving the participants were conducted according to the guidelines of the Declaration of Helsinki. All participants signed the consent form before participating in this study.
Table 1. Baseline characteristics of the participants (n = 25). Data as mean (SD). BMI, body mass index; CI, confidence interval.
Study design
The participants slept for 6.5 h from 10 pm to 4:30 am and started the hike at 5:30 am. Lunch was for 1 h and 30 min, and the consumption of food and juice was served ad libitum. In the present study, it was not possible to control the consumption of liquid. Morning and afternoon snacks were provided while hiking and moving. A 400-mL dose of an isotonic drink was recommended at each period, and all participants were required to drink. Furthermore, 10 bottles of 500mL of water were offered during the daily route, but no consumption was required. The participants were accompanied by a multidisciplinary team of physicians, physiotherapists, physical education professionals, nurses, and nutritionists throughout the five-day course.
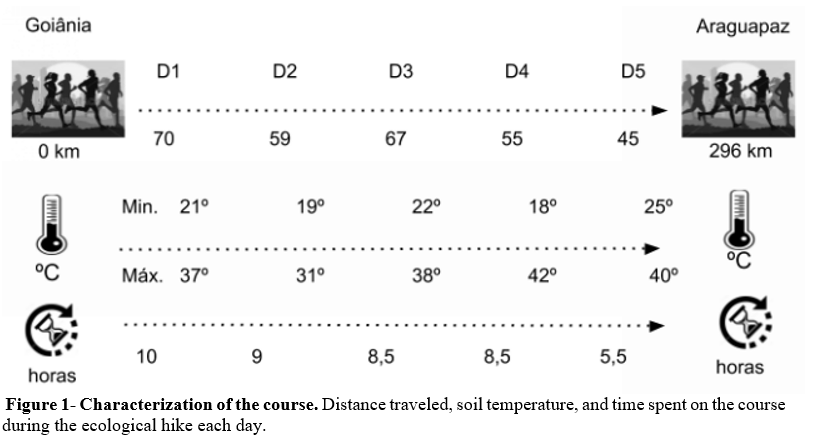
The ecological hike covered five cities with different road characteristics (uphill, downhill, and flat), temperatures and times, and distances traveled per day (Figure 1). The soil temperature was measured with an appropriate thermometer (ACURITE, model 00606TX, IC: 6608A-606TX, FCCID: RNE606 TX, Wisconsin, USA) coupled to a digital reader (model 00782 W3; Wisconsin, USA). The distance and time spent going through each stretch were measured with a vehicle tachograph. On the first day, the participants traveled the longest and where required 10 hours to complete. The highest temperatures were recorded on the fourth and fifth days of the hike. The highest minimum and maximum temperatures occurred on the fourth day, with 18 and 42 °C, respectively. It is noteworthy that during the course they ran at various times.
BM was measured before breakfast (fasted) and at the end of the day (before dinner) for five days by using a portable digital scale with a precision of 0.1 kg (model 2096PP; Toledo, São Paulo, Brazil). During weighing, participants were shirtless and barefoot, wearing only a pair of light shorts, and remained standing in the center of the scale. Height was measured using a portable stadiometer with a precision of 1 mm (Sanny, São Paulo, Brazil). The BMI was calculated by dividing the BM by the height squared (kg/m²).
BIA was performed with a 50-kHz single-frequency bioimpedance (BIA) apparatus, with a four-pole electrode system (Quantum II from RJL Systems, California, USA) and with resistance and reactance accuracy between 0 and 1000 ohms (Ω). All measurements were obtained with the athlete positioned in the supine position on a non-conductive surface and with the limbs spread at approximately 30°. The electrodes were positioned on the dorsal region of the dominant hand (one between the ulna head and the radius, and the other on the proximal phalanx of the third finger) and the foot (one electrode between the medial and lateral malleoli and one in the region of the third metatarsus). Before the placement of the electrodes, the skin was cleaned with 70% alcohol. Three measurements of resistance (R) and reactance (Xc) were performed on all participants. The highest value was used to directly calculate the phase angle (AF) (Xc/R × 180°/π).
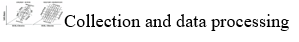
The components of the BIA, R, Xc, and AF, were used to construct an ellipse graph (RXc graph), where the values of R and Xc normalized by height (H) were plotted (Piccoli et al., 1994) (Figure 2). The RXc graph consists of a bivariate analysis of the measurements of the body’s electrical properties and provides a qualitative assessment of hydration and cell mass as compared with a reference population. In this study, the reference data used were those collected before starting the hike.
The 50%, 75%, and 95% tolerance ellipses of the BIVA were constructed to qualitatively assess the participant’s hydration status and were classified as dehydrated, normohydrated, and hyper hydrated (water overload). The displacements of the vectors along the major axis indicate changes in the total body water, which allowed hydration analysis. Subjects with off-ellipse vectors of 75% were classified with alteration of hydration: below the tolerance ellipse of 75% were classified as hyper hydrated; within the ellipse of 75%, normohydrated; and above the tolerance ellipse of 75%, dehydrated (Piccoli et al., 1994).
Statistical Analysis
Results are presented as mean, standard deviation, frequencies, percentages, and graphs. The Shapiro-Wilk test was performed to verify data normality. The analyzed variables were: body mass, resistance, reactance, phase angle, resistance/height, and reactance/height. The variations (Δ) of all BIA and BIVA parameters on each day were calculated by subtracting the values observed in the afternoon from the values collected in the morning.
Variations of differences in shape were verified using repeated-measures ANOVA with Bonferroni post hoc test. In the vector analysis, the confidence ellipses of each day (M, morning; A, afternoon) were compared with the Hotelling’s T-square test and univariate analysis (F-test). The significance level considered was <0.05. Data were analyzed with SPSS version 21.0 (Statistical Package Science Social, Chicago, USA) and BIVA 2002 (University of Padova, Padova, Italy), which was developed by Piccoli et al. (1994).
Results
The BIA and BIVA parameters for each day (morning and evening) were expressed in table 2. The BIA measurements (R, Xc, and PA), also, were different between two moments of evaluation each day, except for the first day in which there was no difference (p = 0.06) in resistance measures. R/H and Xc/H were higher at the end of the first day (p <0.001) and lower in the remaining four days of the tread (Table 2).
Table 2- BIA and BIVA parameters (n=25 athletes).
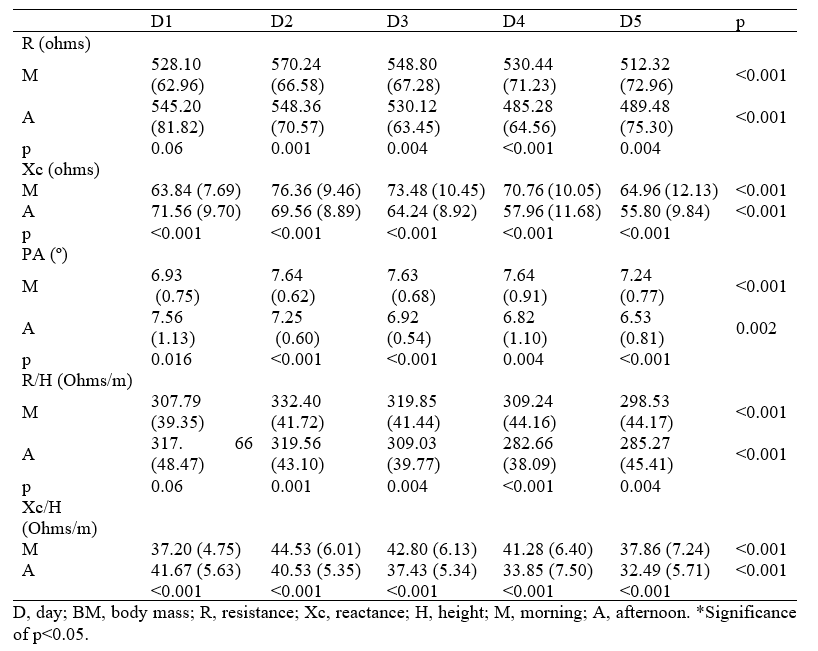
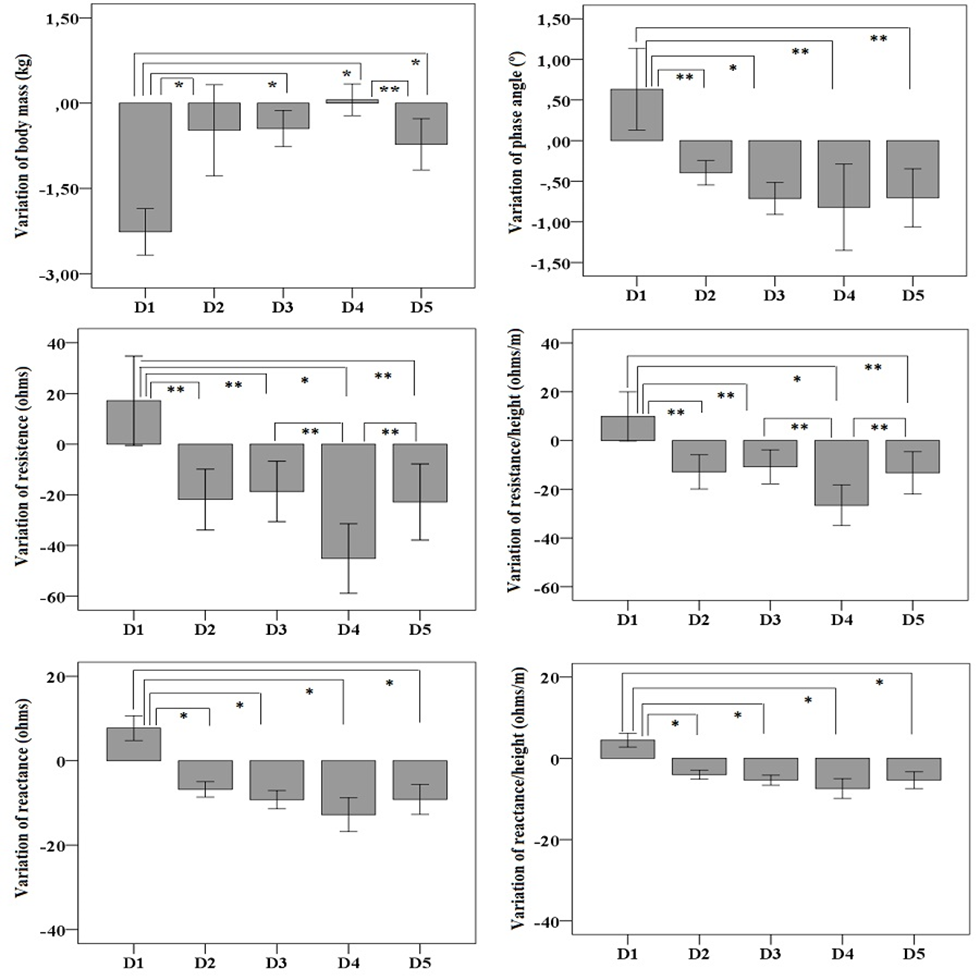
At the end of D1, a significant increase in reactance (Δ= +7.72 ohms, 95% CI: 5.00-10.60, p < 0.001), reactance/stature (Δ= +4.47 ohms/m, 95% CI: 2.89-6.10, p < 0.001), and phase angle (Δ= + 0.63°, 95% CI: 0.25-1.17, p = 0.02) were observed, whereas resistance (Δ = +17.12 ohms, 95% CI: -0.60-33.87, p = 0.06) and resistance/stature (Δ= +9.87 ohms/m, 95% CI: -0.13-19.58, p = 0.06) remained without significant difference (Figure 3). At the end D2, all parameters related to BIA and BIVA increased, but on D4 and D5, the reduction was even greater for resistance (ohms Δ= -45.16, 95% CI: -57.64 to 32.44, p < 0.001), resistance/stature (Δ= -26.58 ohms/m, 95% CI: -34.16 to -18.82, p < 0.001), reactance (Δ= -12.80 ohms, 95% CI: -16.28 to -8.84, p < 0.001), reactance/stature (Δ= -7.44 ohms/m, 95% CI: -9.52 to -5.10, p < 0.001), and phase angle (Δ= -0.82°, 95% CI: -1.26 to -0.29, p = 0.004).
Figure 3 – Show the variation of body mass, resistance and reactance
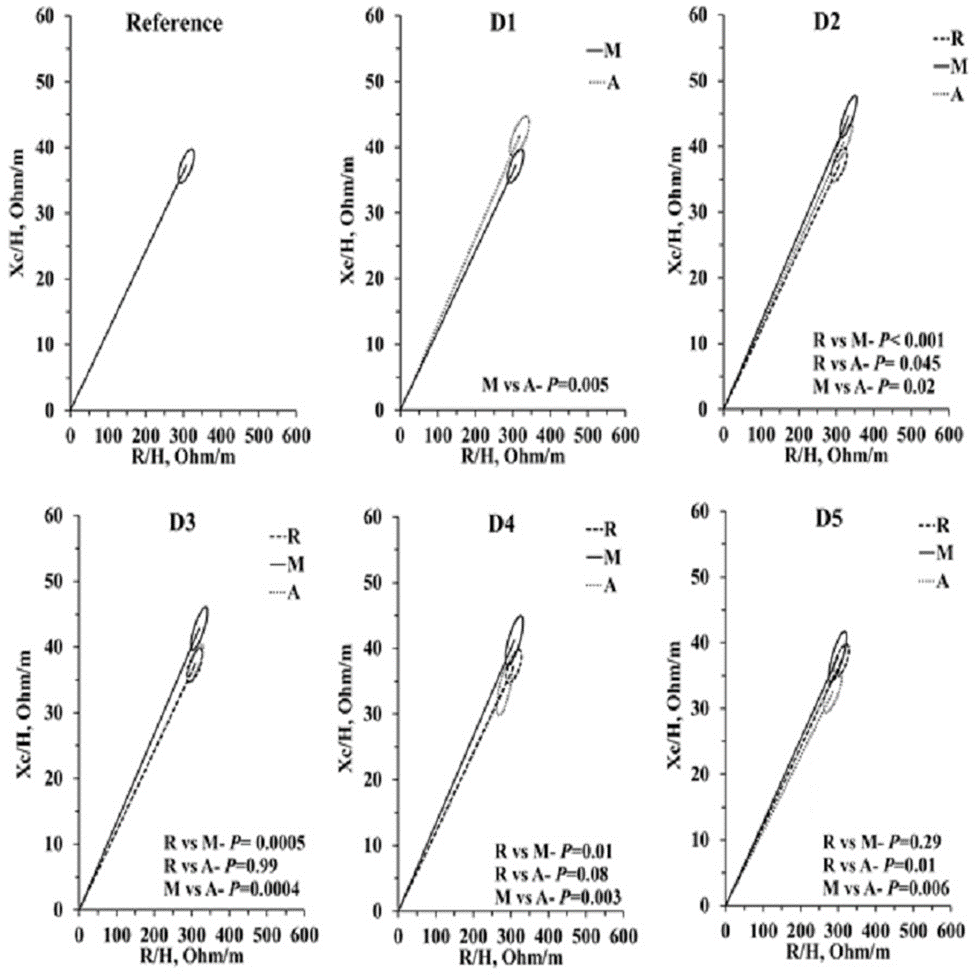
Stature-normalized reactance and resistance values were plotted on the RXc graph. The values showed the mean vector of each measurement (morning and afternoon) during the five-day hike (1 hour before the start and 30 minutes after the end of the hike) (Figure 4). The confidence ellipse considered as reference was constructed with the BIA data collected on D1, before beginning the journey to the last city of the course.
The average morning vectors were higher than the afternoon vectors on every day of the hike (D1, p = 0.005; D3, p = 0.0004; D4, p = 0.003, and D5, p = 0.006), except on D2 (p = 0.02). This result indicates that the participants were more dehydrated at the start of the day than at the end of the day. Only on the last day (D5) of hiking, the reference confidence ellipse and the morning ellipse were similar (p = 0.29), indicating that the hydration of the participants was the same as when the 296-km course was started (Figure 4).
Figure 4 – Show the hydration of the participants was the same as when the 296-km
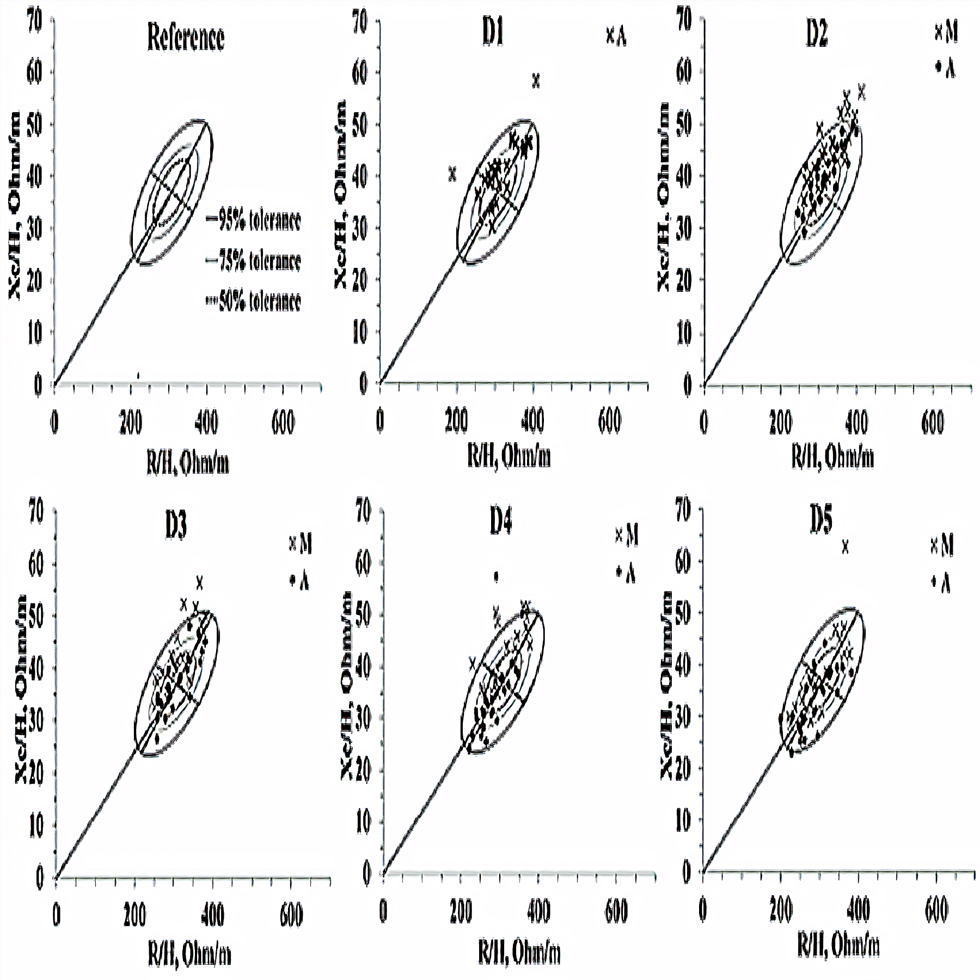
On D1 and D2, the vectors were generally positioned in the upper quadrants, indicating dehydration both in the morning and at the end of the day in some participants (Figure 5). On D3, the vectors were positioned at the center of the tolerance ellipse, indicating a normalization of hydration. On D4 and D5, the vectors were directed toward hyperhydration.
On D1, 9 (36%) participants with vectors indicated dehydration at the end of the day (70 km/day with the longest course), whereas on D2, 12 (48%) started and 5 (20%) finished hiking dehydrated. On D3, 7 (28%) participants started the day dehydrated, and 3 (12%) remained dehydrated at the end of the day. The vector of 1 (4%) participant on D3 was already positioned toward hyperhydration. On D4 and D5, 7 (28%) and 3 (12%) participants started dehydrated, respectively. At the end of D5, 3 cases (12%) of hyperhydration at the beginning of the hike and 9 (36%) at the end of the course were noted. This finding shows some adaptation in the hydro electrolytic and cardiovascular systems in the middle to the end of the course.
Figure 5 – Show the vectors were generally positioned in the upper quadrants, indicating dehydration both in the morning and at the end of the day in some participants
Discussion
Of the participants, three athletes had symptoms of dehydration and had to undergo intravenous hydration. According to the results of the BIA, the participants ended the day hydrated but started the day dehydrated. The confidence ellipse in the morning indicated a larger vector when compared to the baseline ellipse, except in D5. Individual vectors plotted in the tolerance ellipse plot indicated dehydration on the first two days, normalization of hydration on the third day (ellipse of 75% tolerance), and hyperhydration on the last two days. To our knowledge, this study is the first to use BIVA to evaluate the hydration of participants during aerobic long-distance activity (>200km) using BIVA.
About BIA and BIVA parameters, the R and R/H on D1 were larger at the end of the day than in the morning, showing a positive and significant variation. This result suggests that there was an opposition to the flow of electric current in the cell membranes. This phenomenon is attributed to reduced intra and extracellular volume, which leads to loss of body water volume (Piccoli et al., 2014; Aspromonte et al., 2017) by diuresis and sweat. Thus, the participants showed dehydration at the end of D1.
As for Xc and Xc/H, the variation was positive on D1. These parameters are known to reflect cell capacitance in energy storage. They are related to cell membrane structure, function, and permeability, probably an adaptation mechanism in an attempt to minimize the loss of cellular integrity (Aspromonte et al., 2017). From D2, the variation of BIA and BIVA parameters became negative; the participants exhibited increased resistance and reduced reactance at the start of the hike. The participants started D2-D4 days dehydrated and with impairment in cell function and permeability. Notably, water intake during the day was performed ad libitum according to the subjective perception of thirst and need of water consumption of each athlete. Also, the participants went through a night of rest without any fluid intake. The need for rehydration between aerobic activities has been confirmed in the literature (Abián-Vicén et al., 2012). However, in the present study, water replacement may have been sufficient until the end of the day’s hike, but not during the night, which led to dehydration at the start of the day.
Maintaining hydration is vital for athletes, and it is an important factor in performance during long-term exercise. Body mass loss is a marker of dehydration that is most commonly used in athletes (Sawka et al., 2007). Thus, intravenous rehydration could be an alternative for participants who suffer from water loss and elevated temperatures, a procedure that was performed in three athletes of the present study.
The phase angle showed similar results to R and Xc. As it is a parameter that depends on capacitance and reflects integrity, cellular permeability, and total body water (Kyle et al., 2004; Aspromonte et al., 2017), its higher values indicate better cell functional capacity and body water distribution. There is evidence in the literature that resistance training increases phase angle, suggesting an improvement in cell membrane integrity (Fukuda et al., 2016; Ribeiro et al., 2017).
The migration of the individual vectors within the nomogram (tolerance ellipse) allowed independent qualitative analysis of the athlete’s body size. The occurrence of dehydration (D1 and D2), normohydration (D3), and hyperhydration (D4 and D5) in participants was detected with the vectors positioned in the upper quadrants, centered in the ellipse of 50% and 75% of tolerance, and in the lower quadrants, respectively (Figure 3).
BIVA has been used to monitor chronic conditions, such as cardiac diseases, patients on hemodialysis, and those who are hospitalized (Castillo-Martínez et al., 2012a; Kyle et al., 2012; Norman et al., 2012; Piccoli et al., 2014). In the present study, BIVA was used to show the dehydration of participants at dawn each day, presenting longer and steeper vectors compared with the vectors at the end of the day, which suggests dehydration, where even the breakfast (before starting the hike) did not sufficiently hydrate the participants.
During prolonged physical activity, maintaining adequate body fluids is essential (Moreno et al., 2013). Intake of the liquid or isotonic solution should be stimulated to maintain the body in a stable state. An imbalanced body state can lead to severe cardiac dysfunctions, whose mechanisms have not been described in the literature (Moreno et al., 2013). As dehydration occurs during conditions of intravascular volume reduction and plasma hyperosmolarity, intolerance to orthostatic position and increased sympathetic activity (tachycardia) may occur after exercise to protect the body against hypotension (Charkoudian et al., 2003).
The strengths of the study are related to the use of BIA and BIVA parameters daily before and after each day of hiking. The parameters can be used to detect changes in the hydration level. These results can help to achieve optimal food consumption strategies before and after hiking, and water replenishment at daytime and night. The limitations of the study were the lack of quantification of water and food intake by the participants and levels of muscle and inflammatory metabolic markers. The findings suggest that participants should be monitored for water replenishment, particularly for day-to-day changes. Future studies should investigate beyond the effects of water control, intensity responses, and hiking duration on the cardiovascular and immune systems of the participants.
Conclusions
BIA and BIVA showed positive variation, indicating dehydration at the end of the first day. However, on the succeeding four days, the variation was negative, indicating that the participants finished the day hydrated, but started the day dehydrated. Individual vectors plotted in the tolerance ellipse plot indicated dehydration on the first two days, normalization of hydration on the third day (ellipse of 75% tolerance), and hyperhydration on the last two days.
ADDITIONAL INFORMATION AND DECLARATIONS
Funding
The authors received no funding for this work.
Competing Interests
The authors declare that they have no competing interests.
Authors Contributions
- Viviane Soares conceptualization of the project, analysis, interpretation, writing of the paper, and final approval of the manuscript.
- Ivan Silveira de Avelar conceptualization of the project, data acquisition, critical review of the paper, and approval of the final version.
- Patrícia Espíndola Mota Venâncio critical review of intellectual content.
- Matias Noll c review of the intellectual content and approval of the final version.
References
Abbas SR, Zhu F, Levin NW. 2015. Bioimpedance can solve problems of fluid overload. Journal of Renal Nutrition. DOI: 10.1053/j.jrn.2014.10.014.
Abián-Vicén J, Del Coso J, González-Millán C, Salinero JJ, Abián P. 2012. Analysis of dehydration and strength in elite badminton players. PLoS ONE. DOI: 10.1371/journal.pone.0037821.
Aspromonte N, Monitillo F, Valle R, Iacoviello M. 2017. Bioimpedance vectorial analyses in cardiorenal syndrome. In: Cardio-Nephrology: Confluence of the Heart and Kidney in Clinical Practice. DOI: 10.1007/978-3-319-56042-7_16.
Castillo-Martínez L, Colín-Ramírez E, Orea-Tejeda A, González Islas DG, Rodríguez García WD, Santillán Díaz C, Gutiérrez Rodríguez AE, Vázquez Durán M, Keirns Davies C. 2012a. Cachexia assessed by bioimpedance vector analysis as a prognostic indicator in chronic stable heart failure patients. Nutrition. DOI: 10.1016/j.nut.2011.11.024.
Castillo-Martínez L, Colín-Ramírez E, Orea-Tejeda A, Islas DGG, García WDR, Díaz CS, Rodríguez AEG, Durán MV, Davies CK. 2012b. Cachexia assessed by bioimpedance vector analysis as a prognostic indicator in chronic stable heart failure patients. Nutrition 28:886–891.
Charkoudian N, Halliwill JR, Morgan BJ, Eisenach JH, Joyner MJ. 2003. Influences of hydration on post-exercise cardiovascular control in humans. Journal of Physiology. DOI: 10.1113/jphysiol.2003.048629.
Cheuvront SN, Montain SJ. 2017. Myths and methodologies: Making sense of exercise mass and water balance. Experimental Physiology. DOI: 10.1113/EP086284.
Eickemberg M, Oliveira C, Roriz AK, Sampaio LR. 2011. Bioimpedância elétrica e sua aplicação em avaliação nutricional Bioelectric impedance analysis and its use for nutritional assessments. Revista de Nutrição. DOI: 10.1590/S1415-52732011000600009.
Fukuda DH, Stout JR, Moon JR, Smith-Ryan AE, Kendall KL, Hoffman JR. 2016. Effects of resistance training on classic and specific bioelectrical impedance vector analysis in elderly women. Experimental Gerontology. DOI: 10.1016/j.exger.2015.12.002.
Haas V, Riedl A, Hofmann T, Nischan A, Burghardt R, Boschmann M, Klapp B. 2012. Bioimpedance and bioimpedance vector analysis in patients with anorexia nervosa. European Eating Disorders Review. DOI: 10.1002/erv.1166.
Hoffman MD, Goulet EDB, Maughan RJ. 2018. Considerations in the Use of Body Mass Change to Estimate Change in Hydration Status During a 161-Kilometer Ultramarathon Running Competition. Sports Medicine. DOI: 10.1007/s40279-017-0782-3.
Khalil SF, Mohktar MS, Ibrahim F. 2014. The theory and fundamentals of bioimpedance analysis in clinical status monitoring and diagnosis of diseases. Sensors (Switzerland). DOI: 10.3390/s140610895.
Kyle UG, Bosaeus I, De Lorenzo AD, Deurenberg P, Elia M, Gómez JM, Heitmann BL, Kent-Smith L, Melchior JC, Pirlich M, Scharfetter H, Schols AMWJ, Pichard C. 2004. Bioelectrical impedance analysis – Part I: Review of principles and methods. Clinical Nutrition. DOI: 10.1016/j.clnu.2004.06.004.
Kyle UG, Soundar EP, Genton L, Pichard C. 2012. Can phase angle determined by bioelectrical impedance analysis assess nutritional risk? A comparison between healthy and hospitalized subjects. Clinical Nutrition. DOI: 10.1016/j.clnu.2012.04.002.
Logan-Sprenger HM, Heigenhauser GJ, Jones GL, Spriet LL. 2015. The effect of dehydration on muscle metabolism and time trial performance during prolonged cycling in males. Physiological reports 3:e12483.
Lukaski HC, Piccoli A. 2012. Bioelectrical impedance vector analysis for assessment of hydration in physiological states and clinical conditions. In: Handbook of Anthropometry: Physical Measures of Human Form in Health and Disease. DOI: 10.1007/978-1-4419-1788-1_16.
Malecka-Massalska T, Smolen A, Zubrzycki J, Lupa-Zatwarnicka K, Morshed K. 2012. Bioimpedance vector pattern in head and neck squamous cell carcinoma. Journal of Physiology and Pharmacology.
Moreno IL, Pastre CM, Ferreira C, de Abreu LC, Valenti VE, Vanderlei LCM. 2013. Effects of an isotonic beverage on autonomic regulation during and after exercise. Journal of the International Society of Sports Nutrition. DOI: 10.1186/1550-2783-10-2.
Norman K, Stobäus N, Pirlich M, Bosy-Westphal A. 2012. Bioelectrical phase angle and impedance vector analysis – Clinical relevance and applicability of impedance parameters. Clinical Nutrition. DOI: 10.1016/j.clnu.2012.05.008.
Piccoli A, Codognotto M, Piasentin P, Naso A. 2014. Combined evaluation of nutrition and hydration in dialysis patients with bioelectrical impedance vector analysis (BIVA). Clinical Nutrition. DOI: 10.1016/j.clnu.2013.08.007.
Piccoli A, Rossi B, Pillon L, Bucciante G. 1994. A new method for monitoring body fluid variation by bioimpedance analysis: The RXc graph. Kidney International. DOI: 10.1038/ki.1994.305.
Ribeiro AS, Schoenfeld BJ, Souza MF, Tomeleri CM, Silva AM, Teixeira DC, Sardinha LB, Cyrino ES. 2017. Resistance training prescription with different load-management methods improves phase angle in older women. European Journal of Sport Science. DOI: 10.1080/17461391.2017.1310932.
Sawka MN, Burke LM, Eichner ER, Maughan RJ, Montain SJ, Stachenfeld NS. 2007. Exercise and fluid replacement. Medicine and Science in Sports and Exercise. DOI: 10.1249/mss.0b013e31802ca597.
Soares V, de Avelar IS, Andrade SRS, Vieira MF, Silva MS. 2013. Body composition of chronic renal patients: Anthropometry and bioimpedance vector analysis | Composição corporal de pacientes renais crônicos em hemodiálise: Antropometria e análise vetorial por bioimpedância. Revista Latino-Americana de Enfermagem. DOI: 10.1590/0104-1169.3060.2360.
1, 3 Educação Física e Fisioterapia, Laboratório de Avaliação e Intervenção em Fisioterapia, Centro Universitário de Anápolis – Uni Evangélica, Anápolis, Goiás, Brasil.
2 Instituto Federal Goiano de Ceres, Ceres, Goiás, Brasil.
4 Educação Física, Secretaria da Educação do Estado de Goiás, Goiânia, Goiás, Brasil.
Autor correspondence:: Rua da Prata, chácara 330, 780, casa 8, Condomínio Rio Branco, Jardim novo mundo, Goiânia-Goiás, CEP: 74.715-590, Brasil
Endereço de e-mail: isavelar2000@gmail.com