REGISTRO DOI:10.5281/zenodo.12175207
Ébano Henrique da Silva Rizério1
Joel Augusto Moura Porto2
Ronaldo Santos Guedes3
ABSTRACT
This scientific article presents a comprehensive analysis of the results of an evaluation conducted across the entire municipal education network of Santa Inês, in the state of Bahia, covering students from the 2nd to the 9th grade. The article focuses on the mathematics tests and uses statistical analyses. particularly the internal consistency criteria Cronbach’s Alpha, along with the reference matrix of the Basic Education Assessment System (SAEB, acronym in Portuguese). The main objective of this research is to understand the current reality of student performance in mathematics in the municipal network of Santa Inês. To achieve this objective, the data collected in the evaluation are subjected to rigorous statistical analyses, including the calculation of Cronbach’s Alpha to assess the internal consistency of the tests. The use of the SAEB reference matrix allows for a comparative and contextualized analysis of the results, providing valuable insights into how the students of Santa Inês-BA compare with national standards and which specific areas of mathematics may require greater attention. The results of this analysis will serve as the basis for the formulation of educational public policies in the municipality. aiming at improving the teaching of mathematics and, consequently, increasing student performance. The research has a significant impact on the allocation of resources and efforts to areas of greatest need, contributing to the quality of education in Santa Inês-BA and to informed decision-making in the field of education. This study highlights the importance of statistical analysis and the use of tools such as Cronbach’s Alpha and the SAEB reference matrix to understand the local educational landscape, as well as to support evidence-based educational interventions.
RESUMO
Este artigo científico apresenta uma análise abrangente dos resultados de uma avaliação realizada em toda a rede municipal de ensino de Santa Inês, no estado da Bahia, abrangendo alunos do 2º ao 9º ano. O artigo trata do recorte nas provas de matemática e utiliza análises estatísticas, em particular os critérios de consistência interna Alfa de Cronbach, juntamente com a matriz de referência do Sistema de Avaliação da Educação Básica (SAEB). O objetivo principal desta pesquisa é compreender a realidade atual do desempenho dos alunos em matemática na rede municipal de Santa Inês. Para atingir esse objetivo, os dados coletados na avaliação são submetidos a análises estatísticas rigorosas, incluindo o cálculo do Alfa de Cronbach para avaliar a consistência interna das provas. A utilização da matriz de referência do SAEB permite uma análise comparativa e contextualizada dos resultados, fornecendo insights valiosos sobre como os alunos de Santa Inês-BA se comparam com os padrões nacionais e quais áreas específicas da matemática podem requerer maior atenção. Os resultados desta análise servirão como base para a formulação de políticas públicas educacionais no município, visando à melhoria do ensino da matemática e, consequentemente, ao aumento do desempenho dos alunos. A pesquisa tem um impacto significativo no direcionamento de recursos e esforços para áreas de maior necessidade, contribuindo para a qualidade da educação em Santa Inês –BA e para a tomada de decisões informadas no campo da educação. Este estudo destaca a importância da análise estatística e da utilização de ferramentas como o Alfa de Cronbach e a matriz de referência do SAEB para compreender o panorama educacional local, bem como para embasar intervenções educacionais com base em evidências.
INTRODUCTION
Santa Inês is a municipality located in the state of Bahia, in the Northeast of Brazil. Founded in 1962, the municipality has unique geographical and socioeconomic characteristics. With regard to educational data from elementary education, they play a crucial role in the development of the local community. Santa Inês-BA has a municipal education network that serves elementary school students. This network is responsible for providing a solid educational foundation for the children of the region. Like many municipalities in Brazil, Santa Inês faces challenges in the educational system. including the need to improve learning rates in Mathematics, Portuguese, and other elementary school subjects.
The analysis of student performance in elementary education is essential to understand educational progress. This involves applying assessments and tests to identify areas of difficulty and implement improvement strategies. This study consists of a statistical analysis of the results of evaluations carried out in the network (Santa Inês Educational Assessment System – SAESI) by all students enrolled from the 2nd to the 9th grade in the municipal network of Santa Inês-BA.
Students were evaluated individually, by class, school years, schools, and the education network as a whole. Based on the data found, comparisons were made with the performance of this same network with the average results of the Basic Education Assessment System (SAEB, acronym in Portuguese) test of the municipality itself, the state of Bahia, and Brazil, in order to understand the current panorama and future perspectives of performance in SAEB.
THE IMPORTANCE OF CONDUCTING AN ASSESSMENT IN THE NETWORK TO DEVELOP WORK STRATEGIES
Conducting assessments in the education network, whether student performance evaluations, curriculum assessments, or institutional evaluations, is essential for the development and improvement of education quality. These assessments provide valuable information that helps to develop more effective work strategies and drive educational progress.
Assessments allow for the identification of the specific needs of students, teachers, and schools. Based on the results, it is possible to direct resources and efforts to areas that require more attention, such as subjects in which students face more difficulties. Continuous evaluation of student performance provides data that makes it possible to track their progress over time, which is crucial to ensure that all students are advancing in their academic skills according to established educational goals. Additionally, assessment results enable educational managers and teachers to make informed decisions about the curriculum, teaching methods, resource allocation, and intervention programs, all aimed at maximizing student learning.
Assessments also help identify gaps in the curriculum and areas that can be improved, allowing schools to adjust their study programs to meet the specific needs of students and ensure that the curriculum is relevant and aligned with educational standards. Accountability and transparency are fundamental components of education, and assessments provide objective evidence of school performance, helping to create transparency and accountability in the educational system. Moreover, teachers and educators can use assessment results to identify areas where they need to improve their pedagogical practices, promoting continuous professional development and the improvement of teaching.
Sharing assessment results with parents and community members can create a sense of shared responsibility for educational success, involving stakeholders in discussions on how to improve local education. Finally, assessments can serve as a basis for evaluating the effectiveness of educational policies at the municipal, state, or national level, helping in the formulation of more grounded and effective policies.
ANALYZING THE DATA
The SAESI Assessment was conducted between May and September 2023 in the five schools of the municipal network of Santa Inês, Bahia, Brazil, involving about 900 students from the 2nd to the 9th grade of Elementary School II. In this article, we will evaluate the specific results from the 6th to the 9th grade in the subject of Mathematics, but we will also use data obtained from the analysis of the previous school years.
Taking Freire (1970) as a reference, he advocates for formative assessment, which is continuous and oriented towards learning. He supported the idea of assessments that help students reflect on their own learning and progress.
Peregrino (2005) addresses the challenges and importance of educational assessment in the 21st century, highlighting the role of exams as an essential tool in collecting data to improve teaching and learning. He discusses how exams can provide valuable information for educators, researchers, and decision-makers, helping to guide curriculum development, identify areas for improvement, and monitor student progress. Reading this article provides insights into the ongoing relevance of assessment through exams in the field of education.
GENERAL RESULTS OF THE ELEMENTARY SCHOOL II ASSESSMENT
In Table 01, we present the performance data by school year for the Santa Inês-BA Education System in the Assessment Applied to Elementary School II students.
Table 01. General results of the municipality.
Stage Indicator Number of students SAESI 2023.2 (% = points) IDEB Municipal Average 2021- Mathematics IDEB 2021 Average 6th grade Elementary School Mathematics 118 38.21% 191.05 points —– —– 7th grade Elementary School Mathematics 104 38.30% 191.5 points —– —– 8th grade Elementary School Mathematics 126 32.24% 161.2 points —– —– —– 9th grade Elementary School Mathematics 112 38.32% 191.6 points 222.87 4.4
Source: Authors (2024).
Fig 01. Results per municipality, with the number of students and their scores.
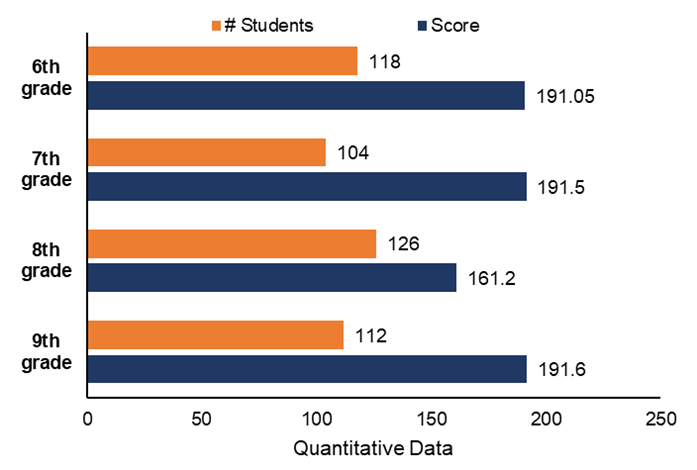
Source: Authors.
To better understand the information contained in the above table, we chose to clarify the captions:
- What is the SAESI average? It is the average for the referenced school year, considering ALL students in the indicated school year.
- What is the Municipality SAESI average? It is the average of all students evaluated through the SAESI assessment, considering ALL (445 students) students in the school network who took the assessment.
- What is IDEB? It is an important metric used to assess the quality of basic education in Brazil. It is calculated based on various factors that reflect students’ performance in national assessments, as well as the school approval rate.
The column with SAESI-SAEB data refers to the score achieved in the SAESI test converted to SAEB parameters, considering a full flow (1.00) with the assessment applied to the reliability indices found. Considering the existence of the municipal average, which was calculated in a weighted manner, it is noticed, through Table 01, the existence of points of attention that will be discussed later in our text. Table 02 presents the performance standards of students in Mathematics for each school year.
Table 02. Performance standards per school year.
Grade Below Basic (less than 20%) Basic (from 20% to 50%) Adequate (between 50% and 74%) Advanced (equal to or greater than 75%) Students in levels Below Basic and Basic Students in levels Below Basic and Basic (%) 6th 17 86 15 0 103 87.29% 7th 21 66 17 0 87 83.65% 8th 28 95 2 1 123 97.62% 9th 18 83 8 3 101 90.18%
Source: Authors (2024).
Fig 02. Number of students per year school concerning their performance standards. A) In absolute values. B) In a percentage base.
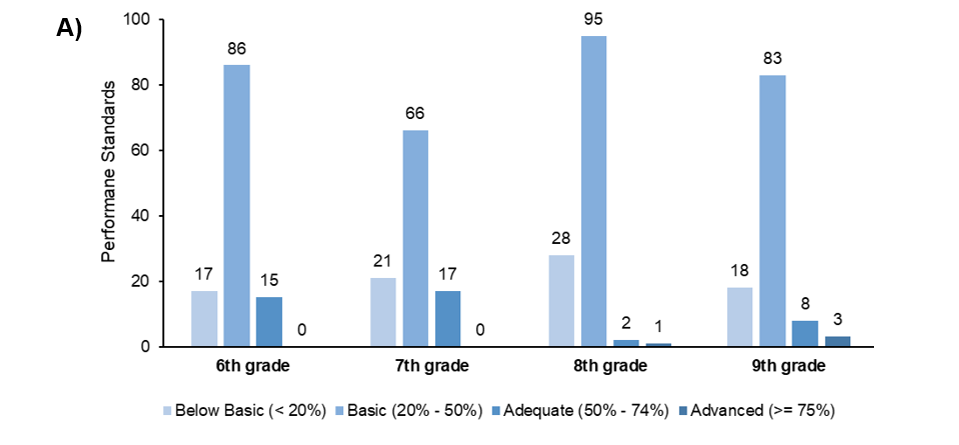
Source: Authors (2024).
TEST RELIABILITY
Reliability is the probability of an item performing its function for a specified period under defined conditions of use. Cronbach (1951) defined the alpha coefficient as a measure of the internal consistency of a test or scale. This measure is widely used in evaluating the reliability of measurement instruments, whether they are questionnaires, psychometric tests, or rating scales.
The Cronbach’s alpha coefficient ranges from 0 to 1, where values closer to 1 indicate greater internal consistency, meaning that the test items are consistently correlated. Therefore, when assessing the reliability of a test, Cronbach’s alpha coefficient is a widely accepted reference measure, providing valuable information about the consistency of test results. In his seminal 1951 study, Cronbach detailed the calculation of the alpha coefficient and its application in practice.
He demonstrated how this measure can be used to evaluate the consistency of test items and how it can be interpreted in research data analysis. Since then, Cronbach’s alpha coefficient has become an essential tool in assessing the reliability of measurement instruments in various research areas, including psychology, education, medicine, and other social sciences. Therefore, by using Cronbach’s alpha coefficient in this research, we are following a widely recognized and established practice in evaluating the consistency and reliability of tests and scales.
The confidence interval of the test based on Cronbach’s alpha coefficient is given by: Poor (0.00 – 0.69), Fair (0.70 – 0.79), Good (0.80 – 0.89) and Excellent (0.90 – 0.99). Considering the universe of analysis, we have the following test reliability results in Table 06.
Table 03. Compiled data on the reliability of the applied test.
School year Number of students Cronbach’s alpha Reliability 6th grade 118 Mathematics 0.61 Poor 7th grade 104 Mathematics 0.68 Poor 8th grade 126 Mathematics 0.42 Poor 9th grade 112 Mathematics 0.69 Poor
Source: Authors (2024).
After verifying the sample data, we identified that low reliability could compromise the faithful analysis of the objectives proposed by the study. However, this issue should be evaluated more thoroughly in another research phase.
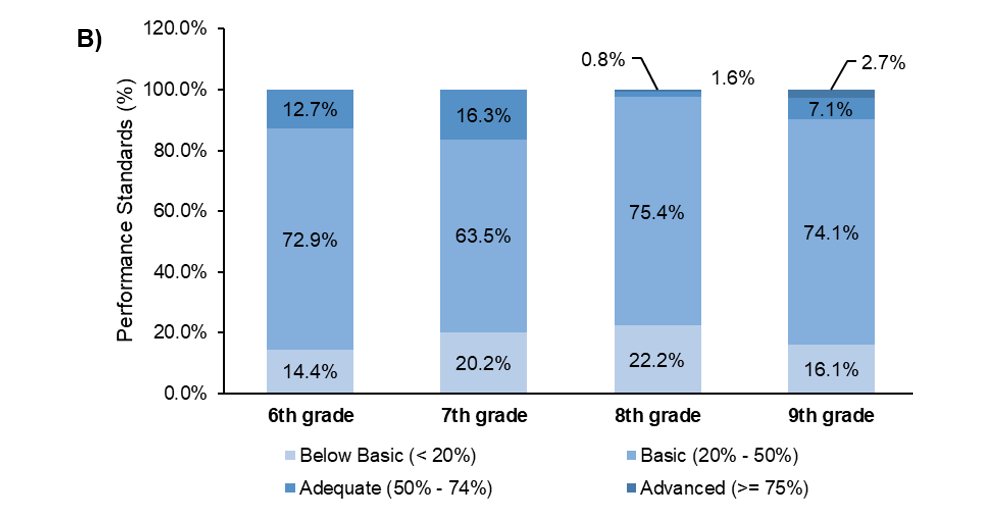
ANALYSIS OF CONSIDERED MOST DIFFICULT AND EASIEST QUESTIONS
The evaluation consisted of 20 multiple-choice questions in the area of mathematics, each with 4 alternatives — one correct and three distractors — covering various topics, descriptors, and proficiency levels. The analysis is based on the number of correct and incorrect answers to the questions presented to students in the SAESI Assessment, according to the reference matrix.
Table 04. Most difficult questions 6th grade.
Code Descriptor Correct Questions D25 Carry out calculations involving operations with rational numbers (addition, subtraction, multiplication, division and potentiation). 9.32% D26 Solve problems with rational numbers that involve operations (addition, subtraction, multiplication, division and potentiation). 11.02% D23 Identify equivalent fractions. 12.72% D21 Recognize the different representations of a rational number. 13.56% D17 Identify the location of rational numbers on the number line. 24.58% D28 Solve a problem involving percentages. 26.27% D21 Recognize the different representations of a rational number. 27.12% D28 Solve a problem involving percentages. 27.12% D19 Solve problems with natural numbers involving different meanings of operations (addition, subtraction, multiplication, division and potentiation). 28.81% D19 Solve problems with natural numbers involving different meanings of operations (addition, subtraction, multiplication, division and potentiation). 31.36%
Source: Authors (2024).
Table 05. Easiest questions 6th year.
Code Descriptor Correct Questions D21 Recognize the different representations of a rational number. 80.51% D36 Solve problems involving information presented in tables and/or graphs 72.88% D26 Solve problems with rational numbers that involve operations (addition, subtraction, multiplication, division and potentiation). 72.88% D26 Solve problems with rational numbers that involve operations (addition, subtraction, multiplication, division and potentiation). 69.49% D23 Identify equivalent fractions. 61.02% D19 Solve problems with natural numbers involving different meanings of operations (addition, subtraction, multiplication, division and potentiation). 55.93% D17 Identify the location of rational numbers on the number line. 52.54% D28 Solve a problem involving percentages. 40.68% D24 Recognize the decimal representations of rational numbers as an extension of the decimal numbering system, identifying the existence of “orders” such as tenths, hundredths and thousandths. 34.75% D26 Solve problems with rational numbers involving operations (addition, subtraction, multiplication, division and potentiation). 33.90%
Source: Authors (2024).
Table 06. Most difficult questions 7th grade.
Code Descriptor Correct Questions D28 Solve a problem involving percentages. 13.46% D17 Identify the location of rational numbers on the number line. 17.31% D33 Identify an equation or a first-degree inequality that expresses a problem. 19.23% D25 Carry out calculations involving operations with rational numbers (addition, subtraction, multiplication, division and potentiation). 22.12% D33 Identify an equation or a first-degree inequality that expresses a problem. 25.96% D34 Identify a system of first-degree equations that expresses a problem. 26.92% D25 Carry out calculations involving operations with rational numbers (addition, subtraction, multiplication, division and potentiation). 26.92% D24 Recognize the decimal representations of rational numbers as an extension of the decimal numbering system, identifying the existence of “orders” such as tenths, hundredths and thousandths. 30.77% D34 Identify a system of first-degree equations that expresses a problem. 32.69% D26 Solve problems with rational numbers involving operations (addition, subtraction, multiplication, division and potentiation). 33.65%
Source: Authors (2024).
Table 07. Easiest questions 7th year.
Code Descriptor Correct Questions D36 Solve problems involving information presented in tables and/or graphs. 57.69% D19 Solve problems with natural numbers involving different meanings of operations (addition, subtraction, multiplication, division and potentiation). 57.69% D19 Solve problems with natural numbers involving different meanings of operations (addition, subtraction, multiplication, division and potentiation). 57.69% D16 Identify the location of whole numbers on the number line. 54.81% D36 Solve problems involving information presented in tables and/or graphs 52.88% D16 Identify the location of whole numbers on the number line. 50.96% D17 Identify the location of rational numbers on the number line. 50.00% D29 Solve problems involving proportional, direct or inverse variations between quantities. 50.00% D26 Solve problems with rational numbers that involve operations (addition, subtraction, multiplication, division and potentiation). 47.12% D24 Recognize the decimal representations of rational numbers as an extension of the decimal number system, identifying the existence of “orders” such as tenths, hundredths and thousandths 39.42%
Source: Authors (2024).
Table 08. Most difficult questions 8th grade.
Code Descriptor Correct Questions D13 Solve problems involving the calculation of the area of plane figures. 7.14% D26 Solve problems with rational numbers that involve operations (addition, subtraction, multiplication, division, and exponentiation). 11.90% D17 Identify the location of rational numbers on the number line. 13.49% D28 Solve problems that involve percentage. 17.46% D21 Recognize the different representations of a rational number. 18.25% D24 Recognize the decimal representations of rational numbers as an extension of the decimal numbering system, identifying the existence of “orders” such as tenths, hundredths, and thousandths. 24.60% D5 Recognize the conservation or modification of measures of sides, perimeter, and area in the enlargement and/or reduction of polygonal figures using grid meshes. 24.60% D30 Calculate the numerical value of an algebraic expression. 27.78% D33 Identify an equation or a first-degree inequality that expresses a problem. 28.57% D3 Identify properties of triangles by comparing measures of sides and angles. 30.16%
Source: Authors (2024).
Table 09. Easiest questions 8th year.
Code Descriptor Correct Questions D12 Solve problems involving calculating the perimeter of plane figures. 71.43% D19 Solve problems with natural numbers involving different meanings of operations (addition, subtraction, multiplication, division and potentiation). 57.94% D3 Identify properties of triangles by comparing side and angle measurements. 45.24% D37 Associate information presented in lists and/or simple tables with the graphics that represent them and vice versa 45.24% D18 Perform calculations with integers involving operations (addition, subtraction, multiplication, division and potentiation). 44.44% D34 Identify a system of first-degree equations that expresses a problem. 41.27% D20 Solve problems with integers involving operations (addition, subtraction, multiplication, division and potentiation). 34.92% D6 Recognize angles such as changes in direction or turns, identifying right and non-right angles. 34.13% D29 Solve problems involving proportional, direct or inverse variations between quantities. 33.33% D4 Identify relationship between quadrilaterals, through its properties. 33.33%
Source: Authors (2024).
Figure 03. Percentage of the easiest and most difficult questions answered correctly by school year. A) 6th grade. B) 7th grade. C) 8th grade.
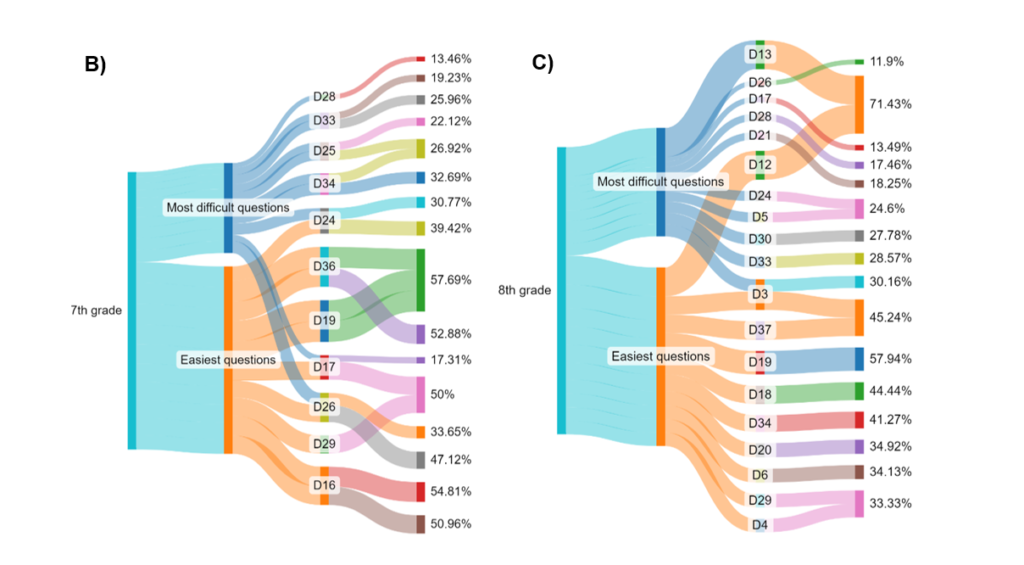
Source: Authors (2024).
FEATURED INDICATORS
After the global analysis of the assessment applied in a census manner to students from the 6th to the 9th year, it was possible to identify well-developed descriptors and critical indicators. who need interventions to guarantee the right to learning. The following tables present. by area and by school year the highlighted indicators.
Table 10. Most accurate skills/descriptors in Mathematics.
Year Descriptors – Most Accurate Skills/Descriptors in Mathematics Descriptors – Least Correct Skills/ Descriptors in Mathematics 6th grade D21 – Recognize the different representations of a rational number. D25 – Carry out calculations involving operations with rational numbers (addition, subtraction, multiplication, division and potentiation). 7th grade D36 – Solve problem involving information presented in tables and/or graphs D28 – Solve a problem involving percentages 8th grade D12 – Solve a problem involving calculating the perimeter of flat figures. D13 – Solve a problem involving calculating the area of flat figures. 9th grade D1- Locate explicit information in a text. D21- Recognize different positions between two or more opinions relating to the same fact. or the same topic.
Source: Authors (2024).
Here we see a limitation regarding RESOLVING, as a critical point in Mathematics, which points to the urgent need to intervene with diverse activities that help in the development of these skills, highlighting the fact that this item was the most critical in the application of the test SAESI in the initial grades.
RESUMPTION OF SEQUENTIAL DATA
Below we present in summary the descriptors highlighted for each school year. This global vision helps us visualize the education network as a whole.
Table 11. Highlighted descriptors in Mathematics and average proficiency by school year.
School year Best Developed Descriptor Descriptor with Limitations Perc. Proficiency Average Level 2nd D1 – Associate a number of objects in a collection with a natural number. D7 – Decompose natural numbers. 54.86% 274.3 Proficient- Level 6 3rd D8 – Calculate the result of addition or subtraction involving natural numbers. D29 – Solve problems using the decimal writing of banknotes and coins of the Brazilian Monetary System. 40.09% 200.45 Basic – Level 4 4th D22 – Identify the time on digital or pointer clocks. D12 – Solve a problem that involves more than one operation with natural numbers. 45.99% 229.95 Proficient – Level 5 5th D28 – Read information presented in bar or column graphs. D13 – Recognize and use characteristics of the decimal number system. such as groupings and exchanges in base 10 and the principle of place value. 50.43% 252.15 Proficient- Level 6 6th D21 – Recognize the different representations of a rational number. D25 – Carry out calculations involving operations with rational numbers (addition, subtraction, multiplication, division and potentiation). 38.21% 191.05 Basic – Level 3 7th D36 – Solve a problem involving information presented in tables and/or graphs D28 – Solve a problem involving percentages. 38.30% 191.5 Basic – Level 3 8th D12 – Solve a problem involving calculating the perimeter of flat figures. D13 – Solve a problem involving calculating the area of flat figures. 32.24% 161.2 Insufficient – Level 2 9th D1 – Locate explicit information in a text. D21 – Recognize different positions between two or more opinions relating to the same fact, or the same topic. 38.32% 191.6 Basic -Level 3
Source: Authors (2024).
Fig. 04. Students’ score in mathematics from 2nd to 9th grades.
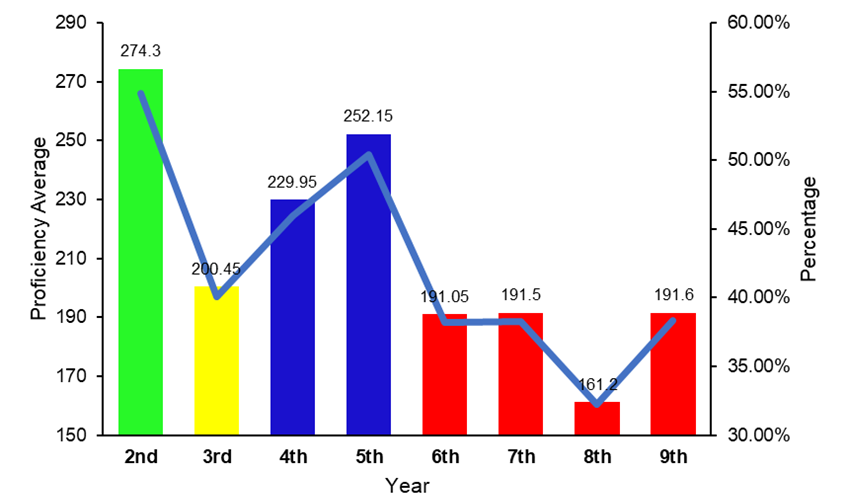
Source: Authors (2024).
FINAL CONSIDERATIONS
The analysis of the presented skill descriptors reveals the existence of descriptors that demonstrate a solid development in students’ competencies, while others show limitations. In the group of better-developed descriptors, we can highlight the ability to associate a quantity of objects with natural numbers, calculate additions and subtractions involving natural numbers, identify times on digital or analog clocks, read information on bar or column graphs, and locate explicit information in a text.
On the other hand, the descriptors with limitations indicate areas where students may encounter challenges. These include the decomposition of natural numbers, solving problems involving more than one operation with natural numbers, using characteristics of the decimal numbering system, understanding different representations of rational numbers, calculations with rational numbers, solving problems involving percentages, calculating perimeter and area of flat figures, as well as recognizing different positions among various opinions related to the same fact or theme.
Therefore, the conclusion of this study indicates that educational efforts need to be directed toward strengthening the competencies related to the descriptors with limitations. This can be achieved through more effective teaching strategies, improved educational resources, and a more comprehensive curriculum approach that addresses the identified challenge areas in greater depth. Additionally, it is important to recognize the significance of curriculum adaptation and attention to the individual needs of students to ensure that everyone has the opportunity to fully develop their skills in mathematics and reading.
Ultimately, the evaluation of the descriptors provides valuable information that can guide the improvement of teaching and learning, ensuring that students acquire the necessary skills to face the challenges of today’s world. Building a solid foundation in these areas is essential for the educational and intellectual development of students, preparing them for a future of success and achievements.
REFERENCES
Cronbach. L.J. Ano de Publicação: 1951 Título do Artigo/Livro: Coefficient alpha and the internal structure of tests Título do Periódico/Editora: Psychometrika Volume: 16 Páginas: 297-3.
Freire. P. (1970). Pedagogia do Oprimido. Paz e Terra.
INEP. (2022). Matriz de Referência do SAEB – Matemática 2022. [Documento Online]. Disponível em: https://download.inep.gov.br/educacao_basica/saeb/matriz-de-referencia-de-matematica_2001.pdf
Pellegrino. J. W. Ano de Publicação: 2005 Título do Artigo/Livro: Assessment Challenges in the 21st Century Título do Periódico/Editora: Educational Researcher Volume: 34 Número: 1 Páginas: 32-37.
1University Professor at the State University of Southwestern Bahia (UESB), Brazil
Master in Physics Teaching
2PhD Student at Jülich Research Center, Germany
Master in Genetics and Molecular Biology
3Project Management Specialist
Undergraduate Student in Agricultural Engineering at the Federal University of Recôncavo da Bahia