REGISTRO DOI: 10.5281/zenodo.12593873
Guilherme de Souza Vieira1
Fernanda Antunes1
Isabella Cristina Morales2
Josias Alves Machado3
Priscilla Olivieri Benck de Jesus1
Alexandra de Faria do Amaral1
Gustavo Sepulveda de Almeida Moura1
André Lacerda de Abreu Oliveira2*
Abstract
The early diagnosis of sepsis increases the chances of its successful treatment. Biomarkers are able to distinguish between systemic inflammatory response syndrome and sepsis and are used to monitor pro- and anti-inflammatory changes associated with the host response to pathogens. A total of 11 rats underwent sepsis induction and measured systolic, diastolic and mean arterial blood pressure. Leukocyte counts, procalcitonin, and nitric oxide also were measured 0, 2, and 4 hours after the induction of sepsis using the cecal ligation and puncture method. The animals were divided into two groups: control (SHAM) and induced. Procalcitonin levels remained within the normal range for an inflammatory response throughout the experiment. There was a statistically insignificant increase in nitric oxide levels. All animals showed increased diastolic arterial blood pressure; however, the increase in the induced animals was even more pronounced. Procalcitonin and nitric oxide levels can increase due to surgical manipulation, while arterial blood pressure was not a good predictor for the onset of sepsis during the time period studied here.
Introduction
Sepsis is a syndrome caused by an uncontrolled systemic inflammatory response of the individual that is of bacterial, fungal, or viral origin. If not treated promptly, sepsis progresses to septic shock, which is characterized by severe depletion of intravascular volume and cellular hypoxia and can lead to multiple organ failure and death [1].
With a mortality rate of 30–50%, severe sepsis and septic shock are the major causes of admission and death in the intensive care unit (ICU). In the United States, 751,000 cases and 215,000 deaths annually are estimated. In Brazil, the incidence is 57 per 1000 patients per day and the mortality rates of patients with severe sepsis and septic shock are 47.3% and 52.2%, respectively [2].
Although the symptoms are known, distinguishing the cause of sepsis in patients with clinical signs of acute inflammation in the emergency room and ICU remains problematic [3].
The early recognition and treatment of sepsis contributes to recovery success and, consequently, higher survival rates [1]. The presence of certain components in the pathogen membrane induces the release of specific inflammatory mediators characterizing the initial phase of sepsis. Biomarkers are able to distinguish between SIRS and sepsis, and a strategy to monitor the pro- and anti-inflammatory changes associated with the host response to pathogens [3].
In recent years, researchers have consequently attempted to diagnose sepsis early and change or interrupt its course. However, the poor clinical outcome and/or continuing high mortality rates of patients with sepsis have not yet resulted in an immediate or successful solution to this problem.
The use of biomarkers has been suggested to assist with early diagnosis; therefore, it may be an immediate appropriate therapy for patients with sepsis in the ICU. A biomarker is an indicator of normal biological processes as well as the pathogenic or pharmacological responses that may lead to a therapeutic intervention [4].
Procalcitonin (PCT) is a biomarker encoded by the CALC-1 gene located on chromosome 11. The mRNA is translated into pre-PCT and the product of this translation is modified in PCT, a 116-amino-acid prohormone that is then converted into calcitonin, an active 32-amino-acid hormone that is involved in calcium and phosphorous metabolism [5].
In healthy patients, PCT is secreted almost exclusively by thyroid C-cells [5]; under these conditions, the serum PCT concentrations are very low (0.05 ng/mL) [7]. In the case of septicemia, particularly when associated with bacteremia, an alternative pathway for PCT production may become activated that increases its serum levels. Lung, colon, and spleen tissues can produce PCT in these cases [5]. Levels > 2 ng/mL indicate susceptibility to developing severe sepsis or septic shock [7].
PCT is considered a good clinical marker due to its high specificity and sensitivity (8), and its serum levels increase within 3 hours, peaking at around 6–12 hours in addition to being highly stable in the serum and plasma [7]. It also has a half-life of 24–30 hours in the circulation [9].
Endogenous nitric oxide (NO) is generated from L-arginine by the action of the enzyme NO synthase (NOS). The activity of NOS in the oxidation of L-arginine leads to the production of NO and L-citrulline [10].
NOS enzymes are essential to NO production, and three isoforms have been described: constitutive NOS (cNOS), which can be endothelial (eNOS) or neuronal (nNOS), both of which are calcium-dependent and inducible NOS (iNOS), which is calcium-independent [11].
Under normal physiological conditions, cNOS is present in endothelial cells, brain cells, and platelets and synthesizes NO from L-arginine in a calcium- and NADPH-dependent manner.
NO acts as a neurotransmitter when produced by nNOS expressed in the central and peripheral nervous systems, kidneys, skeletal muscles, myocardium, and pancreas [11]. It has an important physiological function as a neurotransmitter as well as a mediator in coupling neural metabolism and cerebral blood flow [10].
Not expressed under normal conditions, iNOS is induced by cytokines and/or endotoxins in several cell types including macrophages, neutrophils, Kupffer cells, and hepatocytes [12]. Under these conditions, NO is produced from L-arginine by the action of iNOS [10]. This isoform requires several hours to be expressed, but once synthesized, it releases larger amounts of NO than eNOS and nNOS and its production continues indefinitely until L-arginine and/or the co-factors required for its synthesis are depleted or when cell death occurs [12].
The expression of iNOS results in a localized or diffuse inflammatory response results from infection or tissue damage. High concentrations of NO, which is toxic to microbes, parasites, and tumor cells, can also harm surrounding healthy cells since this mechanism is responsible for the majority of inflammatory and autoimmune processes [12].
The first biological function attributed to NO was vasodilation mediation, although today NO is also believed to have a role in body temperature control during physiological and pathological conditions [13].
Gasometry is a commonly utilized diagnostic tool for assessing the partial pressures of gases in the blood and the acid-base status. Understanding and employing blood gas analysis enables healthcare providers to interpret respiratory, circulatory, and metabolic disorders [15].
The objective of this study was to evaluate arterial blood pressure, the biomarkers and gasometry in an experimental model of sepsis. Our hypothesis was that arterial blood pressure could predict the onset of sepsis via correlation of its value with the biomarkers involved to acquire a quick and early diagnosis.
Material and Methods
The tests were performed on 11 male wistar rats (Rattus norvegicus) from the Unit of Animal Experimental da Universidade Estadual do Norte Fluminense Darcy Ribeiro, weighing between 250 and 300 grams. They were kept in appropriate cages in groups of 5 animals, covered with wood shavings. The temperature controlled environment possessed 19 °C and humidity of 50 to 60%, maintained in light/dark cycles of 12 hours. Food and water were provided ad libitum. At the moment of the experiment, these animals were placed alone in similar boxes, but smaller, to evaluation in the recommended times.
Anesthesia was delivered with the help of an inhalant mask made from a PET bottle and held together with a smaller mask produced from a 20 mL syringe and filled with native lime to minimize the CO2 rebreathing. The anesthesia was maintained with halothane throughout the procedure.
Invasive arterial blood pressure was measured by cannulation of the carotid artery in which a heparinized cannula was positioned and fixed in the carotid and fixed on the skin of the dorsal region of the neck for subsequent evaluations. The cannula was connected to the sensor of the BioAmp equipment (ADInstruments, São Paulo, Brazil) that transforms the blood pressure information and amplifies the signal in the form of graphics for the computer to enable posterior data analysis using LabChart 7 software (ADInstruments).
The animals were randomly divided into control (SHAM) and experimental groups.
In the SHAM group (n = 5), a laparotomy was performed and the cecum was exposed and returned to the abdominal cavity without causing sepsis. In the experimental group (n = 6), sepsis was induced in the animals by laparotomy and exposure of the cecum followed by cecal ligation and puncture (CLP). The cecum was returned to the abdominal cavity, which was closed with non-absorbable nylon 3/0 wire and simple interrupted sutures.
The CLP was performed as described by Witcherman et al. [16] with a slight modification. The rats were anesthetized with halothane, and a midline abdominal incision was made to expose the cecum, followed by a loose ligation of the apex of the cecum that was filled with feces. The cecum was then punctured three times with a hypodermic needle 40 × 16 and returned to the abdominal cavity to promote fecal extravasation and result in CLP-induced peritonitis.
The animals were evaluated at three time points: immediately after, 2 hours after, and 4 hours after the induction of sepsis.
The evaluation consisted of invasive blood pressure measurement, collection of 1 mL of blood for gasometry, leukocyte count (WBC) and quantification of PCT and NO using a Rat Procalcitonin (PCT) Elisa Kit and a Nitric Oxide (NO2/NO3) Detection Kit. After each blood collection, the volume was replaced with 0.9% saline solution to minimize the possible effects of hypovolemia. At the end of the 4-hour evaluation, the animals were sacrificed.
The following tests were employed for the statistical analysis of numerical values, with p < 0.05: one-way analysis of variance (ANOVA) followed by the Newman-Keuls test, Kruskal-Wallis, Friedman, Dunnett’s. The data were analyzed using GraphPad Prism® 5.0.
Ethics Statement: This study was submitted to Use Ethics Committee of animals of the Universidade Estadual do Norte Fluminense by the number 161.
Results
The recovery of the anesthetic animals was normal and the tests could be performed at the indicated time points.
In both groups, the animals’ WBC counts did not differ significantly, but a pattern of leukocytosis at time point 2 and leukopenia at time point 3 could be observed (Fig. 1).
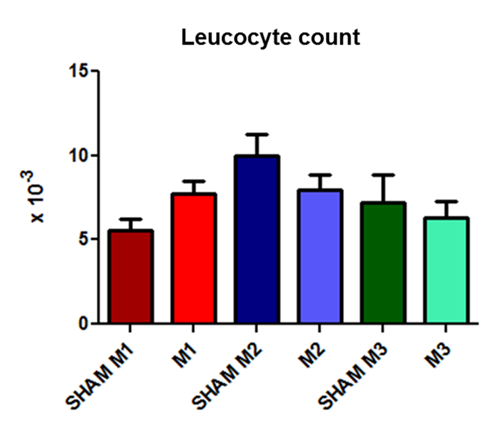
Fig. 1. Leukocyte counts at the three time evaluated points (M1, immediately after; M2, 2 hours after; and M3, 4 hours after the induction of sepsis) compared with those in the SHAM group.
The PCT values remained very similar between groups with values close to 2 ng/mL (Fig. 2).
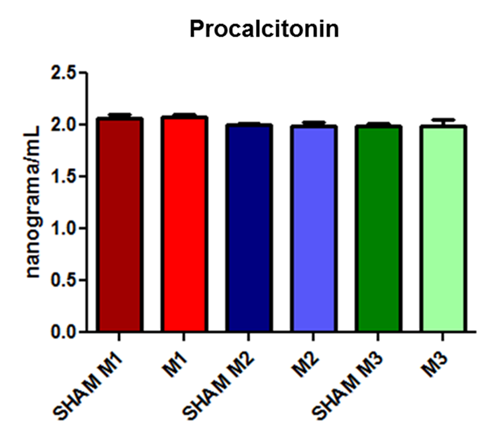
Fig. 2. Procalcitonin concentrations at the three evaluated time points (M1, immediately after; M2, 2 hours after; and M3, 4 hours after the induction of sepsis) compared with those in the SHAM group.
The NO levels showed progressive but insignificant increases at each time point in both groups; in the induced group, the increase was even more pronounced (Fig. 3).
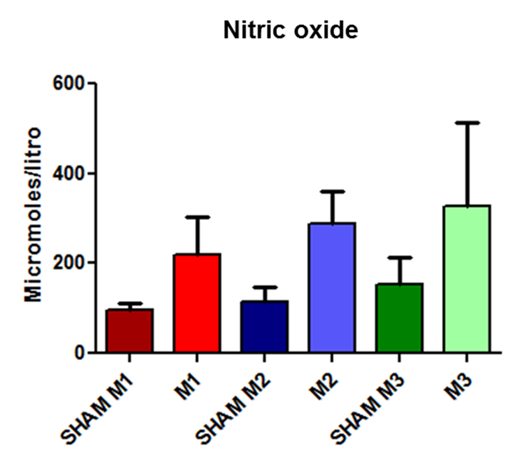
Fig. 3. Released nitric oxide concentrations in SHAM animals and in the experimental model of induced sepsis at the three evaluated time points (M1, immediately after; M2, 2 hours after; and M3, 4 hours after the induction of sepsis).
Systolic arterial blood pressure (SAP) and mean arterial blood pressure (MAP) values did not differ significantly between groups. However, when comparing diastolic arterial blood pressure (DAP), a statistically significant increase in DAP was observed between the animals of the control group at time points 1 and 2 in addition to the difference between sepsis-induced animals at time points 2 and 3 compared to time point 1.
During the experiment and animal observation, blood pressure was measured. As can be observed, systolic, mean, and diastolic blood pressures showed a gradual decrease, becoming significant at M3 (Fig 4).
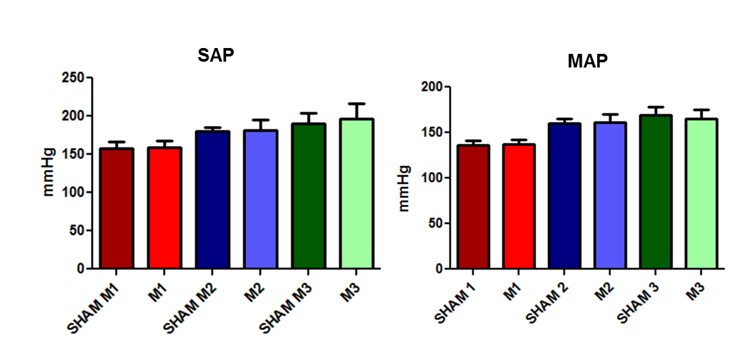
Fig. 4. Changes in the systolic and mean arterial blood pressure in the SHAM and induced animals at the three evaluated time points (M1, immediately after; M2, 2 hours after; and M3, 4 hours after the induction of sepsis).
There was no statistically significant difference observed in Hematocrit and Hemoglobin values between the evaluation time points (Fig 5).
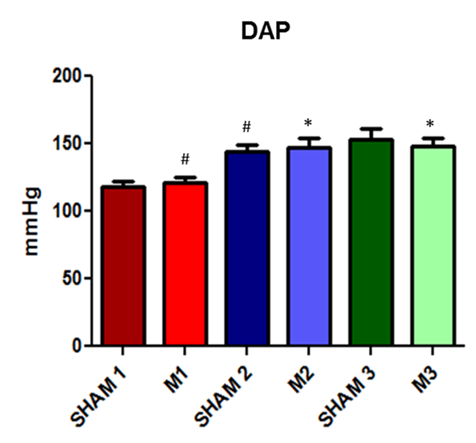
Fig. 5. Evolution of diastolic arterial blood pressure in SHAM and induced sepsis animals at the three evaluated time points (M1, immediately after; M2, 2 hours after; and M3, 4 hours after the induction of sepsis).
A statistical difference was observed in the platelet count evaluation at time point M3 compared to time point M1 (Fig 6).
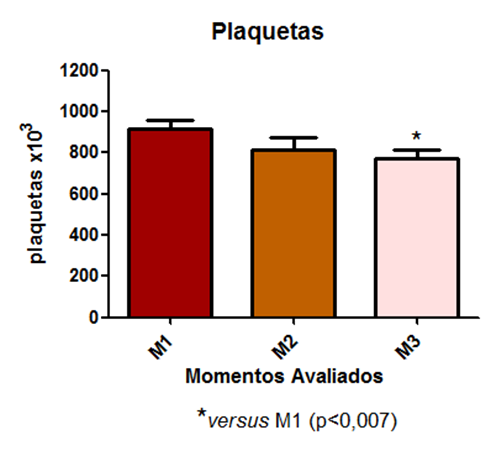
Fig. 6 – A statistical difference was observed in the platelet count evaluation at time point M3 compared to time point M1
An increase in leukocyte count was observed following a similar pattern, i.e., a gradual increase, becoming significant at T3 and T4 (Fig 7).
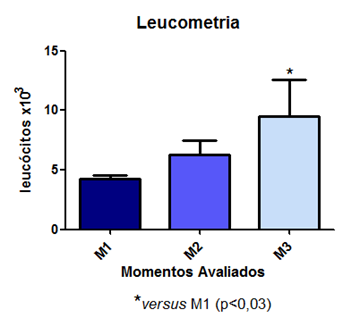
Fig. 7 – An increase in leukocyte count was observed following a similar pattern.
Sepsis was observed to increase the plasma concentration of creatinine. Similarly, elevated levels of plasma urea indicate significant impairment of renal function (Fig 8a and 8b).
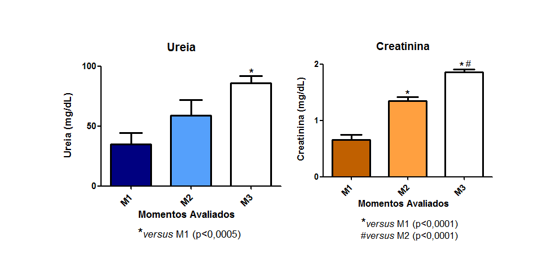
Fig. 8 – Sepsis was observed to increase the plasma concentration of creatinine. Similarly, elevated levels of plasma urea indicate significant impairment of renal function (Fig 8a and 8b).
The pH values did not show any statistical difference and are represented in Figure 9.
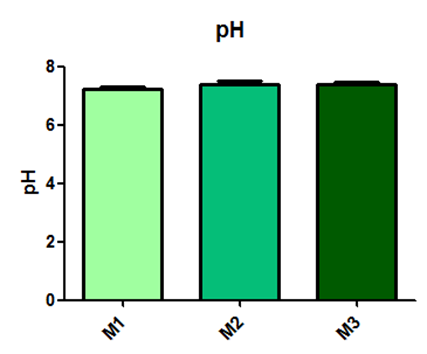
Fig. 9– The pH values did not show any statistical difference
According to the results obtained in the pCO2 measurement, a statistical difference is observed between time point M1 and M2, as shown in Figure 10.
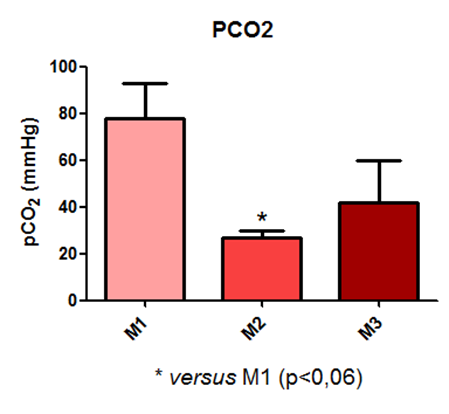
Fig. 10 – According to the results obtained in the pCO2 measurement, a statistical difference is observed between time point M1 and M2.
It was observed that the pO2 values did not show a significant difference with p < 0.06, as shown in Figure 11.
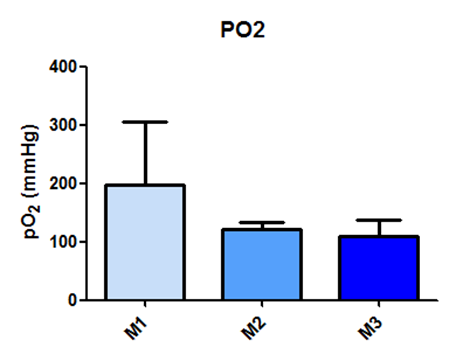
Fig. 11- It was observed that the pO2 values did not show a significant difference with p < 0.06
For the Excess of Base values, a statistical difference was observed between time points M1 and M2, and between M1 and M3, as shown in Figure 12.
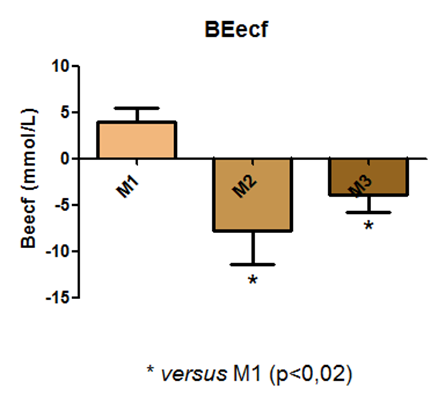
Fig. 12 – For the Excess of Base values, a statistical difference was observed between time points M1 and M2, and between M1 and M3
In the assessment of HCO3 data, a statistical difference was observed between time points M1 and M2, and M1 and M3, as depicted in Figure 13.
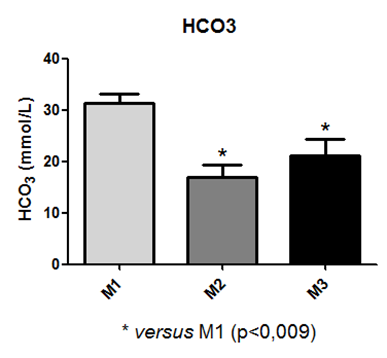
Fig. 13 – In the assessment of HCO3 data, a statistical difference was observed between time points M1 and M2, and M1 and M3
It is also noted that the values obtained for tCO2 also exhibited a statistical difference between time points M1 and M2, and M1 and M3, as shown in Figure14.
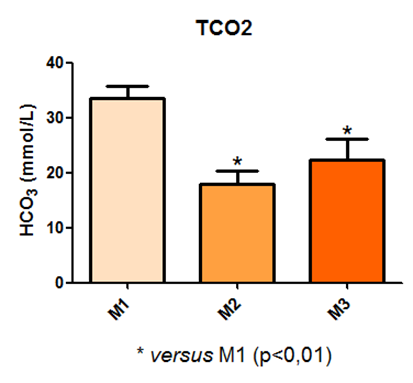
Fig. 14 – It is also noted that the values obtained for tCO2 also exhibited a statistical difference between time points M1 and M2, and M1 and M3
The assessment of oxygen saturation did not show statistical differences in the values obtained between the measured time points, as demonstrated in Figure 15.
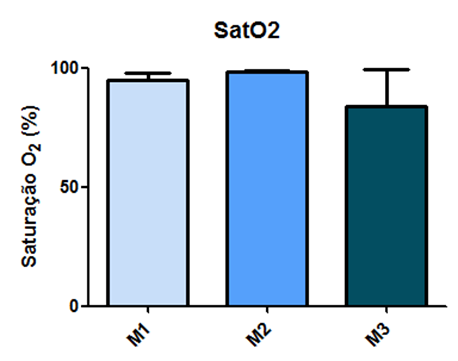
Fig. 15 – The assessment of oxygen saturation did not show statistical differences in the values obtained between the measured time points
The values for Sodium and Potassium did not exhibit statistical differences among the measurement time points, as illustrated in Figure 16.
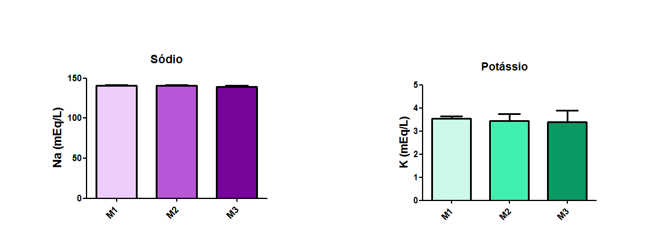
Fig. 16 – The values for Sodium and Potassium did not exhibit statistical differences among the measurement time points.
In the measurement of ionized calcium, a statistical difference was observed between time points M1 and M2, and M1 and M3, as demonstrated in Figure 17.
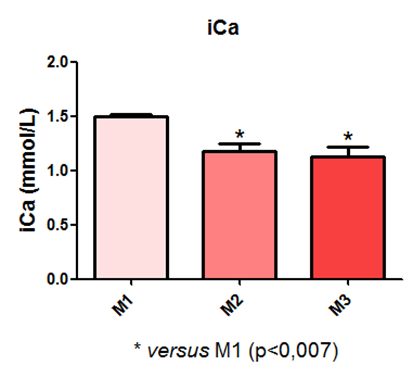
Fig. 17 – In the measurement of ionized calcium, a statistical difference was observed between time points M1 and M2, and M1 and M3
Blood glucose levels varied during the experiment and exhibited a statistical difference between time points M1 and M3, and M2 and M3, as shown in Figure 18.
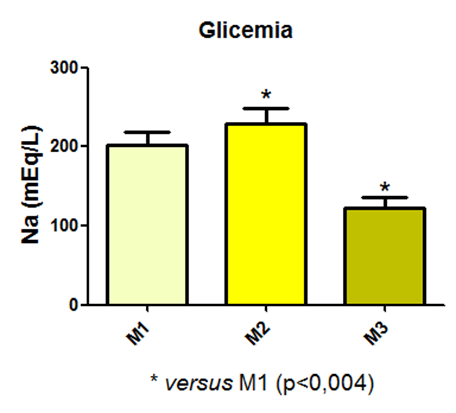
Fig. 18 – Blood glucose levels varied during the experiment and exhibited a statistical difference between time points M1 and M3, and M2 and M3
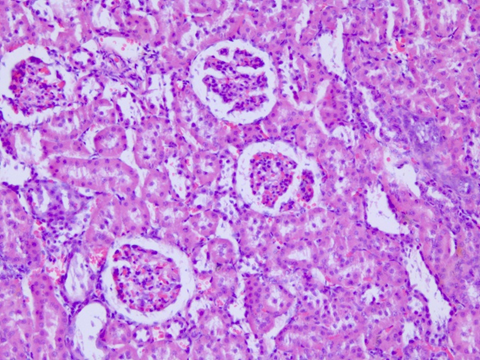
Fig. 19 – Avaliação histopatologica
Regarding the histological evaluation of the animals’ kidneys, the assessment score remained between 0 and 2 (from absent to mild). Hydropic degeneration was observed in the renal cortex of septic animals (Figure 19), compared to the control group (Figure 20), along with mild necrosis, protein loss, and signs of renal regeneration.
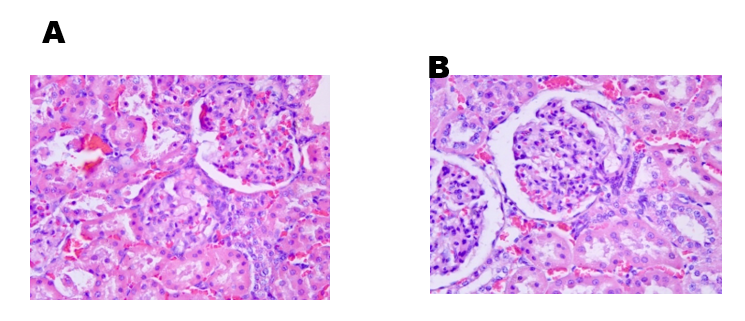
Fig. 20 – avaliação histologica do grupo Controle
Discussion
The PCT levels at the different time points in the induced animals did not differ significantly from the levels of the respective SHAM animals. In this case, the animals were not considered septic since the values obtained were below or very close to 2 ng/mL. However, the animals were in SIRS at all time points as identified by Arkader [6] and Liu et al. [7], who defined PCT values of 0.05–2 ng/mL as indicative of this syndrome.
The SHAM animals that underwent only cecum manipulation without CLP also had elevated PCT levels indicative of SIRS. Since these animals underwent the cannulation procedure to record the blood pressure, it is possible that these increased levels of PCT are the result of surgical manipulation as described by Soreng et al. [5], who claimed that surgeries, severe trauma, and burns are also capable of increasing PCT levels.
The animals were evaluated for only 4 hours, so it is possible that the PCT values were not yet at its peak plasma concentration. According to Liu et al. [7], PCT levels in humans increase over a period of 3 hours and peak at 6–12 hours. The time frame for this response in rats was estimated to be 4 hours since this species has a higher metabolic rate than humans. Accordingly, we estimated that the selected time frame would be sufficient for determining sepsis.
The NO levels did not show statistically significant differences between groups, although it is possible to observe an increase in both SHAM and induced animals since NO values were even higher in the last group. This demonstrates that surgical manipulation may also increase the NO plasma levels and that this model for inducing sepsis was able to increase those levels compared to the SHAM group at the three evaluated time points. The increase of NO confirms the data described by Vieira [12], who affirmed that NO levels increase the production of iNOS when there is an inflammatory involvement resulting from infection or tissue damage.
Although there were no statistically significant differences in the SAP and MAP between the SHAM and sepsis-induced animals, it was clinically possible to observe an increase in SAP, MAP, and DAP at time point 2. This difference may be due to the fact that time point 1 was immediately after the surgical procedure, when the animals could still be recovering from the anesthesia.
The maintenance of a stable MBP throughout the entire procedure shows that despite the connection between NO levels and vasodilation in septic patients, its increase in circulation did not correlate to the decrease in MAP. It can be inferred that an increase in NO precedes clinical hypotension in patients. Pereira et al. [13] also did not observe a relation between mean hypotension and NO increase in sepsis, severe sepsis, or septic shock in dogs.
DAP showed an increase between SHAM time points 1 and 2, induced time points 1 and 2, and induced time points 1 and 3. According to Hajjar et al. [18] the diastolic dysfunction induced by sepsis is not yet well established but occurs by itself or in association with systolic dysfunction. The increase in diastolic pressure observed in this study may be caused by the restriction imposed by the pericardium, which tends to promote rapid ventricular filling [19].
Moreover, Bouhemad et al. [20] evaluated the hearts of patients with septic shock using Doppler echocardiography and observed a reduced relaxation of the left ventricle in 20% of 54 patients.
Rapid ventricular filling and reduced left ventricular relaxation may have been decisive factors for the observed increase of DAP. Since cardiac evaluation, troponin level measurements, and echocardiography were not performed in this case, it is not possible to confirm that this finding may be explained by the changes mentioned above.
Munt et al. [21] also described that more pronounced diastolic changes were observed in the group of septic patients that did not survive.
Metabolic acidosis can reduce sepsis survival through various mechanisms. Firstly, acidosis has been associated with hemodynamic instability, although the association is not always consistent, and the mechanisms are uncertain. Pedoto and colleagues have shown that metabolic acidosis can increase inducible nitric oxide synthase (iNOS) expression, potentially causing vasodilation and shock. The increase in nitric oxide aligns with what was described by Vieira (2007)[22], who stated that nitric oxide levels increase due to iNOS production in the presence of inflammatory involvement resulting from infection or tissue damage. When invasive blood pressure was assessed, arterial hypotension was observed. The literature mentions that patients in septic shock present refractory hypotension despite volume replacement. Additionally, authors also state that nitric oxide promotes vasodilation, leading to a drop in blood pressure. In addition to this, the evolution of heart rate throughout the experimental period also supports these findings; namely, a significant increase at M3 is observed, demonstrating a compensatory effect. REGUEIRA et al. (2011) in a systematic review of 160 experiments on sepsis and acute kidney injury found that the main determinant of renal flow normality in sepsis is heart rate[23].
According to VELISSARIS et al. (2015), metabolic acidosis can result from a primary increase in hydrogen ions (H+) or a reduction in bicarbonate concentration. In acute states of metabolic acidosis, respiratory compensation through hyperventilation results in a relative reduction in PaCO2, while in chronic states, the human body develops renal compensation through HCO3 reabsorption[24]. The etiology of metabolic acidosis is divided into causes that result in a high anion gap (AG) and causes that do not. Bicarbonate is the primary form of CO2 in the human body and can be estimated from pH and pCO2. The normal pH range is 7.35–7.45, and normal bicarbonate levels are 21–28 mEq/L. Blood pH is reduced (acidosis) when the amount of CO2 is elevated and increased (alkalosis) when the amount of CO2 is reduced or when the amount of base, such as bicarbonate, increases in the blood. Bicarbonate is secreted and reabsorbed (conserved) by the kidneys in response to pH changes and is commonly found as sodium bicarbonate (NaHCO3).
It was observed that sepsis led to an increase in plasma creatinine concentration. Similarly, elevated levels of plasma urea also indicate that the animals experienced considerable renal dysfunction. In studies conducted using the experimental sepsis model with intraperitoneal Escherichia coli application, rats exhibited a marked increase in urea and creatinine levels, accompanied by histopathological lesions (edema, hemorrhage, congestion, and necrosis), but they remained septic for seven days (LIMA, 2011). In another study conducted with the same experimental model as this work, PINTO et al. (2012) described a non-significant increase in plasma urea and creatinine values. In the mentioned work, they classified this change as lower risk, with no explanation for the fact. In another study in 2009, DOI et al. concluded that animals became clinically ill 6 hours after cecal puncture surgery, with renal damage, but serum creatinine did not increase until 12 hours later. Nevertheless, they reaffirmed that it is a model that closely resembles the clinical characteristics of sepsis. Endothelial injury in sepsis-induced acute kidney injury (AKI) promotes the formation of intercellular adhesion molecules (ICAM-1), vascular cell adhesion molecules (VCAM), and P and E selectins, which facilitate leukocyte-endothelial interactions, platelet adhesion, and mechanical obstruction of the renal microvasculature. Endothelial dysfunction leads to the formation of pro-inflammatory cytokines by tubular cells that intensify the inflammatory process, primarily promote apoptosis of tubular region cells, and oxidative injury through the generation of reactive oxygen species (ROS).
Regarding the platelet count, it was observed that there was a statistical difference in the assessment between the period and M3 compared to time M1. This is explained by the fact that from systemic inflammatory response syndrome (SIRS) progression to sepsis, there is neutrophil infiltration, increased vascular permeability, and stimulation of fibrin release with thrombus formation (KNÖBL, 2002).
As can be observed, there was stability in the pattern of leukocytes, indicating a significant likelihood of animals beginning to develop leukopenia, marking the onset of severe sepsis. These results corroborate with literature reports described by VANZANT et al. (2011) in sepsis pathophysiology. Araújo Filho and colleagues (2015) found a significant increase in neutrophils and eosinophils in rats 30 minutes after cecal puncture with and without pneumoperitoneum. In summary, sepsis involves the activation of adhesion molecules on the endothelium, resulting in leukocyte-endothelial integration. Active leukocytes increase the release of inflammatory mediators and the generation of ROS by tubular cells, which contribute to the progression of injury and organ failure, characterizing sepsis-induced acute kidney injury (AKI). These more intimate mechanisms of injury were not evaluated in this study; however, the results of lipid peroxidation in the Sepsis group suggest that this cellular and molecular disorganization was present.
Structural kidney injuries are expected to contribute to the renal dysfunction in septic AKI, and acute tubular necrosis is believed to be responsible for this dysfunction. However, studies on experimental sepsis-induced acute kidney injury and post-mortem studies of human sepsis have shown that injuries such as acute tubular necrosis are uncommon. In this regard, studies have compared the histology of post-mortem renal tissue from those who died with and without sepsis. They found more minor tubular lesions, leukocyte infiltration, and apoptosis in septic kidneys. These changes were only focal, with most nephrons appearing normal, and renal dysfunction indices poorly predicted renal histological changes (BELLOMO et al., 2017).
Conclusions
After the end of the experiment and data analysis, we can conclude that despite PCT being a recommended biomarker for the diagnosis and prognosis of sepsis, its production may be increased for other causes such as surgeries and trauma rather than bacterial infections. we can conclude that sepsis induced metabolic acidosis and arterial hypotension, resulting in hypoperfusion and renal dysfunction, confirmed by the increase in serum levels of urea and creatinine, and hydropic degeneration.
The plasma NO concentration may be increased due to surgical manipulation. Despite the fact that this biomarker promotes vasodilation, it is not related to mean arterial hypotension.
The use of arterial blood pressure as the only method of assessment was not a good predictor of sepsis onset during the 4-hour study period. The results of diastolic hypertension found in the present study are not consistent with those found in the studies that cite hypotension in cases of septic shock.
References
1. Vanzant AM, Schmelzer M. Detecting and treating sepsis in the emergency departament. J Emerg Nurs. 2011; 37:47-54.
2. Shiramizo SCPL, Marra AM, Durão MS, Paes AT, Edmond MB, Santos, OFP. Decreasing mortality in severe sepsis and septic shock patients by implementing a sepsis bundle in a hospital setting. PLOS ONE. 2011; 6:1-6.
3. Lvovschi V, Arnaud L, Parizot C, Freund Y, Juillien G, Ghillani-Dalbin P, et al. Cytokine profiles in sepsis have limited relevance for stratifying patients in the emergency department: a prospective observational study. PLOS ONE. 2011; 6:1-13.
4. Sankar V, Webster NR. Clinical application of sepsis biomarkers. J Anesth 2012; 1-15.
5. Soreng K, Levy R. Procalcitonin: an emerging biomarker of bacterial sepsis. Clin Microbiol Newsl. 2011; 33:171-178.
6.
7. Liu YJ, Du P, Rao J. Procalcitonin as a diagnostic and prognostic marker for sepsis caused by intestinal infection: a case report. Eur Rev Med Pharmacol Sci. 2011; 17:1311-1313.
8. Sener G, Ozgur E, Rad AY. Uzun L, Say R, Denizli A. Rapid real-time detection of procalcitonin using a microcontact imprinted surface plasmon resonance biosensor. Analyst. 2013; 189:6422-6428.
9. Patil VK, Morjaria JB, Villers F, Babu SK. Associations between procalcitonin and markers of bacterial sepsis. Medicina (Kaunas) .2012; 48:383-387.
10. Knobel E. Óxido nítrico e sepse. Arq Bras Cardiol. 1996; 67:263-266.
11. Hauser B, Bracht H, Matejovic M, Radermacher P, Venkatesh B. Nitric oxide synthase inhibition in sepsis? Lessons learned from large-animal studies. Anesth Analg. 2005; 101:488-498.
12. Vieira PMAO. Participação do óxido nítrico na infecção experimental de cães pelo Trypanossoma cruzi.[dissertation]. Ouro Preto (MG): Universidade Federal de Ouro Preto; 2007.
13. Pereira FH, Batalhão ME, Cárnio EC. Correlação entre temperatura corporal, pressão arterial e concentração plasmática de óxido nítrico em pacientes com sepse. Rev. Latino-Am. Enfermagem. 2014; 22:1-6.
14.
15. Gattinoni, L., Pesenti, A., Matthay, M. Understanding blood gas analysis. Intensive care medicine, v. 44, n. 1, p. 91-93, 2018.
16. Wichterman KA, Baue AE, Chaudry IH. Sepsis and septic shock—A review of laboratory models and a proposal. Journal of Surgical Research. 1980; 29:189- 201.
17. Diaz MMO. Procalcitonina como biomarcador diagnóstico nas doenças infecciosas. [monograph] Brasília (DF): Universidade de Brasília; 2010.
18. Hajjar LA, Júnior CJF, Mercon ES, Góis AFT, Knobel L, Lage SG. Disfunção miorcárdica na sepse. Rev Bras Ter Intensiva 2004; 16:185-191.
19. Lavine SJ, Campbell CA, Gunther SJ. Effect of increased left ventricular size and filling pressure on diastolic filling. Circulation 1986; 7-11.
20. Bouhemad B, Nicolas-Robin A, Arbelot C, Arthaud M, Féger F, Rouby JJ. Isolated and reversible impairment of ventricular relaxation in patients with septic shock. Crit Care Med 2008; 36:766-774.
21. Munt B, Jue J, Gin K, Tweeddale M. Diastolic filling in human severe sepsis: an echocardiographic study. Crit Care Med 1998; 26:1829-1833.
22. Vieira, P. M. A. O. Participação do óxido nítrico na infecção experimental de cães pelo Trypanossoma cruzi. Minas Gerais: Universidade Federal de Ouro Preto, 2007.
23. REGUEIRA T, et al. Fisiopatología de la insuficiencia renal aguda durante la sepsis. Med Intensiva. v. 35, p. 424-32, 2011
Legends:
Fig. 1. Leukocyte counts at the three time evaluated points (M1, immediately after; M2, 2 hours after; and M3, 4 hours after the induction of sepsis) compared with those in the SHAM group.
Fig. 2. Procalcitonin concentrations at the three evaluated time points (M1, immediately after; M2, 2 hours after; and M3, 4 hours after the induction of sepsis) compared with those in the SHAM group.
Fig. 3. Released nitric oxide concentrations in SHAM animals and in the experimental model of induced sepsis at the three evaluated time points (M1, immediately after; M2, 2 hours after; and M3, 4 hours after the induction of sepsis).
Fig. 4: Evaluation of invasive blood pressure in male Wistar rats (250-300g) subjected to sepsis by cecal puncture, assessed every hour, with M1 as the initial time point.
Fig. 5: Laboratory evaluation of hematocrit and hemoglobin in male Wistar rats (250-300g) subjected to sepsis by cecal puncture, assessed every hour, with M1 as the initial time point.
Fig. 6: Laboratory evaluation of platelet count in male Wistar rats (250-300g) subjected to sepsis by cecal puncture, assessed every hour, with M1 as the initial time point.
Fig. 7: Laboratory evaluation of leukocyte count in male Wistar rats (250-300g) subjected to sepsis by cecal puncture, assessed every hour, with M1 as the initial time point.
Fig. 8: Laboratory evaluation of serum biochemistry (urea and creatinine) in male Wistar rats (250-300g) subjected to sepsis by cecal puncture, assessed every hour, with M1 as the initial time point.
Fig. 9: Laboratory evaluation of pH in male Wistar rats (250-300g) subjected to sepsis by cecal puncture, assessed every hour, with M1 as the initial time point.
Fig. 10: Laboratory evaluation of pCO2 in male Wistar rats (250-300g) subjected to sepsis by cecal puncture, assessed every hour, with M1 as the initial time point.
Fig. 11: Laboratory evaluation of pO2 in male Wistar rats (250-300g) subjected to sepsis by cecal puncture, assessed every hour, with M1 as the initial time point.
Fig. 12: Laboratory evaluation of BEecf in male Wistar rats (250-300g) subjected to sepsis by cecal puncture, assessed every hour, with M1 as the initial time point.
Fig. 13: Laboratory evaluation of HCO3 in male Wistar rats (250-300g) subjected to sepsis by cecal puncture, assessed every hour, with M1 as the initial time point.
Fig. 14: Laboratory evaluation of TCO2 in male Wistar rats (250-300g) subjected to sepsis by cecal puncture, assessed every hour, with M1 as the initial time point.
Fig. 15: Laboratory evaluation of SatO2 in male Wistar rats (250-300g) subjected to sepsis by cecal puncture, assessed every hour, with M1 as the initial time point.
Fig. 16: Laboratory evaluation of Sodium and Potassium in male Wistar rats (250-300g) subjected to sepsis by cecal puncture, assessed every hour, with M1 as the initial time point.
Fig. 17: Laboratory evaluation of iCa in male Wistar rats (250-300g) subjected to sepsis by cecal puncture, assessed every hour, with M1 as the initial time point.
Fig. 18: Laboratory evaluation of blood glucose in male Wistar rats (250-300g) subjected to sepsis by cecal puncture, assessed every hour, with M1 as the initial time point.
Fig. 19: Photomicrograph (40X magnification) of the renal cortex of normal male Wistar rats (250-300g). Hematoxylin-Eosin staining.
Fig. 20: Photomicrograph (40X magnification) of the renal cortex of male Wistar rats (250-300g) subjected to sepsis by cecal puncture.
1 Laboratory of Physisiology and Experimental Pharmacology of the Unit of Animal Experimental, Universidade Estadual do Norte Fluminense Darcy Ribeiro, Campos dos Goytacazes, Rio de Janeiro, Brazil.
2 Laboratory of Complexs Surgerys of the Unit of Animal Experimental, Universidade Estadual do Norte Fluminense Darcy Ribeiro, Campos dos Goytacazes, Rio de Janeiro, Brazil.
3 Chemistry Laboratory and function of proteins and peptides of the Unit of Animal Experimental, Universidade Estadual do Norte Fluminense Darcy Ribeiro, Campos dos Goytacazes, Rio de Janeiro, Brazil
*Corresponding author
E-mail: andrevet@uenf.br (OLIVEIRA, A.L.A.)