REGISTRO DOI: 10.5281/zenodo.7643920
Tiago Rocha Bissochi¹
Lucas Francisco Bianchi Pontes Ivantes¹
Marcia Silva de Araujo¹
Carla Cristina Amodio Estorilio¹
Maria das Graças Contim Garcia¹
ABSTRACT
The advancement of computing power, artificial intelligence and machine learning make it possible to generate optimized geometries based on the efforts required in a project or with the objective of reducing mass. In this article, the differences in mechanical strength of a part generated by traditional 3D design, topological optimization and generative design using the Fusion 360 program were shown. The generated geometries were manufactured by 3D printing, resulting in five samples with different masses, generated with each method. These samples were compared with a traditional sample that served as a reference. The effectiveness of these methods was measured by the ratio of compressive load supported by body mass (MC). The generative design showed an improvement in the CM relation when compared to the topological optimization.
Keywords: 3D printing; Generative Design; Topological Optimization; Strength of materials; Additive Manufacturing.
INTRODUCTION
The Additive Manufacturing (AM – Additive Manufacturing) became popular in the development of products for the ease to manufacture parts of simple or complex geometries generated with CAD – Computer Aided Design (or Computer Aided Design). In the CAD system, software is used to model a part in 3D, to generate project documentation and drawings, and to generate the programming of manufacturing machines.(GROOVER; ZIMMERS, 1984).
By AM, physical prototypes are generated with lower cost and greater speed compared to traditional methods. In addition, when any changes are necessary, the correction is made in CAD and manufactured without the need for new molds (VOLPATO, 2017).
Thus, we seek to reduce the cost of 3D printed parts and their optimization, both in terms of aesthetics and functionality. For this, CAE – Computer Aided Engineering (or Computer Aided Engineering) is used for computerized calculations and simulations. These softwares make it possible to simulate loads applied to the 3D model to analyze its efforts and its level of safety, without the need for physical prototypes. Some specific computational and artificial intelligence tools have been developed, such as Generative Design (DG) and Topological Optimization (OT).
TOPOLOGICAL OPTIMIZATION (OT)
OT is based on stress analysis by the finite element method, analyzing the structural criticality of a part subject to a pre-established stress and removing material at non-critical points, optimizing the geometric space of the part and preserving the structural properties with mass reduction ( NTINTAKIS; STAVROULAKIS; 2020).
OT distributes the amount of material within the design limitations, eliminating material where efforts are not decisive for part failure, to optimize the design in relation to mass, volume and cost (WESTERVELD, 2021).
In a traditional three-dimensional model, the attachment points, the external loads and the geometries to be preserved are defined. In the optimization, a discretized mesh is generated, the points where there is less tension are analyzed and the regions where to remove material are determined (AUTODESK, 2020).
However, the optimization generated by OT can be difficult to manufacture traditionally, so AM enables the creation of complex geometry prototypes, without affecting the cost due to the difficulty of production (BRACKETT; ASHCROFT; HAGUE, 2011).
GENERATIVE DESIGN (DG)
The DG is also based on the finite element method and aims to generate an optimized part from the required efforts and dimensional constraints (NTINTAKIS; STAVROULAKIS; 2020).
Design requirements such as expected mass, strength requirements, geometric constraints, and material are given. (AUTODESK, 2020). The program can return thousands of solutions, following the following steps: establishing the critical areas of a part or creating a generic model, configuring the exploration characteristics, generating the designs, filtering the best generated shapes, selecting and defining the fit. thin (KRISH, 2011). It is up to the designer to filter the best generated geometries, considering the possibility or impossibility of manufacturing such solutions.
The DG has great growth potential, because combined with AM, it makes it possible to develop lighter objects with the same functionality (AMS BRASIL, 2020).
COMPARATION
DG and OT technologies can be confused, but not the practical application of these two alternatives:
- OT is used when there is already a part and its optimization is necessary, so from an initial three-dimensional model, only one solution is generated;
- The DG is used when there is still no pre-established geometry and we only know the efforts to which a project will be submitted and multiple geometries are generated (KATORI, 2019).
As the DG aims to generate a fully optimized part, the process of generating solutions by DG goes through a OT before being completely solved (WESTERVELD, 2021).
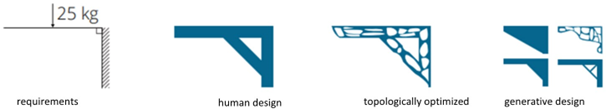
For a better understanding of the differences between traditional design, OT and DG, follow the illustration presented in figure 1.
Barbieri and Muzzupappa (2022) applied both methodologies to compare the design of a suspension arm in relation to the traditional design. They compared the maximum displacement of the arm when subjected to a transverse force, and found that:
- reduced 46% in maximum displacement with a 2% reduction in mass applying OT;
- reduced 42% in maximum displacement for a 38% reduction in mass applying DG.
OT and DG are based on the finite element principle – decomposing the threedimensional model into several elements that are connected together by nodes. In these nodes, stresses and strains of the model are calculated, which will be propagated throughout the entire part. This method helps to reduce costs – requiring less field testing, less time to analyze new products, and improving existing products (KATORI, 2019).
To generate solutions by DG and OT, it is necessary to know the external load that will be applied, direction, direction and place of application. Defining the material gives the modulus of elasticity (SANGEUN et al., 2018). The geometry constraints and fixtures must be known, so the algorithm recognizes where the part cannot be modified and where the part fixtures will be. Geometric constraints are also selected so as not to generate unwanted material. (KENNEDY, 2021).
Figure 1 : Difference between human design, OT and DG (translated).
This work aims to analyze the mechanical strength of the design by OT and DG when compared to each other and to the traditional design method. For this, the geometries were generated using the Fusion 360 software and then they were manufactured by 3D printing. Five samples with different masses were generated for each method, which were compared to each other and to a traditional sample that did not undergo variations. The effectiveness of these methods was measured by the relation Compressive load supported by Body mass (MC).
RESEARCH METHOD
The experiments were carried out in three stages:
- A piece was modeled by the traditional method, then sliced. A sample with seven specimens (CPs) of this part was manufactured by AM.
- Compression tests were performed to determine the maximum load supported by this reference sample.
- Then the OT and DG designs were generated, sliced, printed and tested. For the results, the two most discrepant measurements of each sample were discarded. Print parameters were the same for all parts.
MATERIAL
The CPs were printed with 1.75 mm gauge poly (lactic acid) (PLA) from the manufacturer Esun. This material has 144.789 MPa of tensile strength and 3.86 GPa of Young’s modulus (ESUN, 2021).
The material available in the Autodesk Fusion 360 library is “Plastic”, with density 1.29×10⁻⁶ kg/mm3, 0.40 MPa of tensile strength, 0.709 GPa of Young’s modulus and Poisson’s ratio equal to 0.4 (Autodesk Fusion 360, 2021).
TRADITIONAL DESIGN
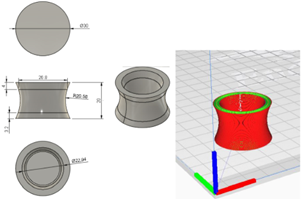
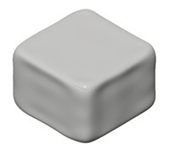
The traditional design, modeled in the Fusion 360 program, represents a regular and standardized geometry, which allowed a compression-only effort that could be compared to a shim for general use. The fabrication drawing for this design is shown in figure 2, as is the print orientation to apply to all designs.
Figure 2 : Traditional design
DESIGN BY TOPOLOGICAL OPTIMIZATION
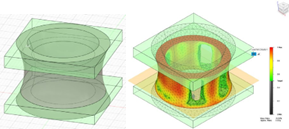
Traditional design was the base geometry for OT application. The upper and lower faces were fixed to ensure the fixation and functionality of the part. In figure 3 the regions where the geometry was preserved and fixed are in green, as well as the result of the optimizations and the efforts on the part.
The mass variation of the samples is due to the need to compare the supported load/mass ratio proposed by the study.
As OT removes material where the part is less stressed, post-processing is usually required in the modeling program to smooth sharp corners. In this study, only one OT sample was smoothed to compare results with the part without post-processing.
Figure 3 : Regions to be preserved in the OT and the result of the optimization
DESIGN GENERATIVE
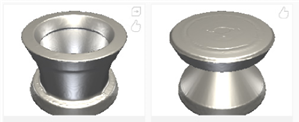
The Fusion 360 program makes it possible to choose between two distinct goals for geometry resolution: maximize stiffness by choosing a target mass or minimize the mass. Figure 4 presents two different geometries generated according to the objective chosen in the program.
Figure 4 : (a) maximized stiffness (b) minimized mass
In this work, the first option was chosen. The same parts of the geometry used in the OT design were preserved (Figure 3) and thecompression force to obtain different mass reductions. The simulations were performed using Autodesk’s online servers.
The program allows you to apply a factor of safety, in addition to some manufacturing options for the part.
OBTAINING SAMPLES
For the mechanical strength tests, three categories of samples were used, totaling 11 samples and for each sample, seven CPs were printed:
- a traditionally generated sample,
- five samples generated by DG with mass variation and
- five samples generated by OT with mass variation, one of them with a smoothed surface.
The OTs Extra and DGs Extra samples were generated after the results obtained from the preliminary tests and provided some important comparisons. The OT Extra sample presents symmetry in relation to the part axis and mass of the OT1 Sample, a characteristic not shown in the first OT samples. The DG Extra sample allowed to compare two different samples with the same design load of 1000 N (DG3).
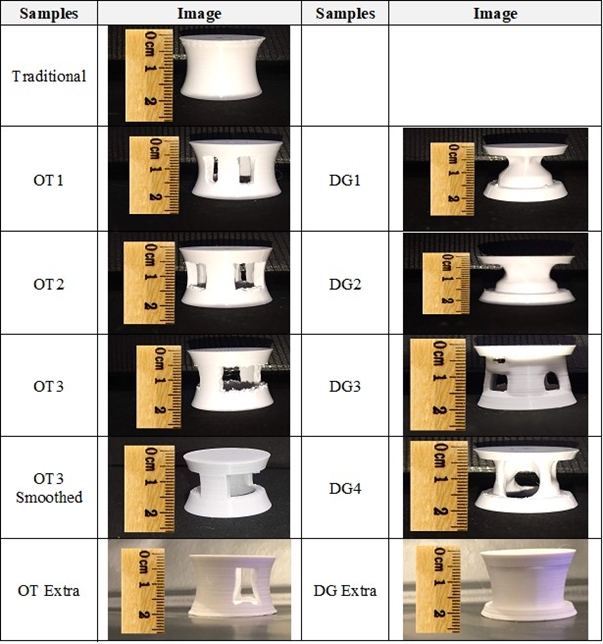
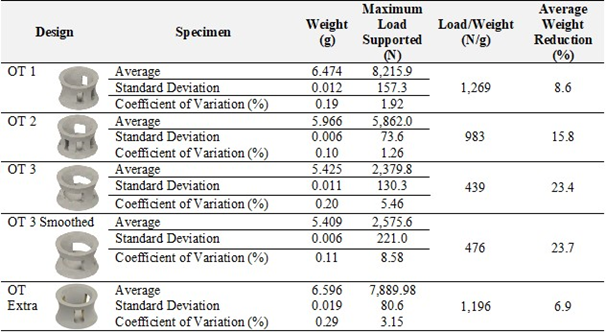
For FDM printing, the Ender 3 printer (CREALITY 3D, 2020) was used, which allowed the simultaneous printing of the seven CPs of each sample. The choice of printing parameters was based on the results obtained by João Fernandes (2016) and by Kaufui Wong and Aldo Hernandez (2012): layer height of 0.2 mm, printing speed of 25 mm/s, extrusion temperature of 220 °C, table temperature of 60 °C, nozzle diameter of 0.4 mm, 100% filling with grid 0°/90° and number of contours equal to 8. Table 1 shows the mass reductions (RM) of the different types of designs.
Table 1 : Images of the printed samples
COMPRESSIVE STRENGTH TEST
This test compared the maximum strength ratio per mass of printed material of the geometries generated by the different methods. The tests were carried out at the NPT (Technological Research Center) of the UTFPR, with a controlled temperature of 23 ± 2ºC, using an EMIC universal testing machine with a 10kN load cell and 10N precision. The CPs were weighed on the balance (Mars Analytic AL500) with precision of 0.001g.
The feed speed of the compression actuator was 10 mm/min according to ISO 604:2002 (ISO 604:2002). Although the standard does not refer to plastics produced via FDM, it is the standard most used by other authors, since there is still no standard for this specific type of manufacturing (BANJANIN et al., 2018).
To perform the tests, each PC was positioned on the base of the EMIC equipment. The load was applied evenly and distributed on the closed upper face. The Force
(N) x Displacement (mm) and Maximum Supported Load (N) curves were obtained using the Tesc program.
RESULTS AND COMPARISONS
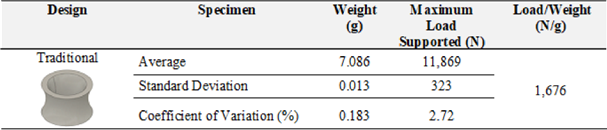
Table 1 shows the results obtained for the PCs of the first battery of tests.
In the Force (N) x Displacement (mm) graph of this sample, the curves presented a similar profile. The CP, with its structure intact, undergoes an elastic deformation and the resistance force of the material grows until it reaches the first peak, when the structure is permanently deformed, which may or may not cause a fracture in the 3D printing seam lines (place where the printer’s extrusion nozzle switches layers, giving rise to a stress concentration point) and collapses, causing the measured force to decrease to its valley. The compression continues and the upper base of the CP starts to crush the material from the underside of the structure, creating a new and stronger compacted structure with greater mechanical resistance, causing the force to rise to a second peak, but this time with total loss of the initial profile. Therefore,
RESULTS OF DESIGNS GENERATED BY OT
It was established that OT-generated designs would be subjected to the traditional sample failure load of 11,869N. The program allowed for mass reduction manually, ignoring whether or not the CP would fail with the established compressive load requirements. Five optimizations were performed (named OT1, OT2, OT3, OT3 Smoothed and OT Extra) and the results are shown in Table 2.
The Force (N) x Displacement (mm) curves of the OT samples show a behavior similar to the traditional one. The CPs OT1, OT2 and OT Extra broke at the seam, after the piece had already reached the maximum point, while OT3 and OT3 Smoothed, with greater mass reduction, did not break.
When performing Fisher’s F test for comparing means at a significance level equal to 0.05, it was found that there was a statistically significant difference between OT1 and OT Extra (OT1 with approximate symmetry), with OT1 obtaining a higher result than than OT Extra. However, smoothing did not lead to a statistically significant difference.
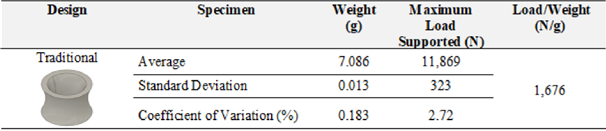
Table 2: Compressive strength of the reference sample
RESULTS OF DESIGNS GENERATED BY DG
The Fusion 360 generated unwanted geometry (Figure 5) or did not return any solutions when subjected to the average load supported by the traditional design in the first battery tests.
Figure 5 : Fusion 360 Geometry for DG with 11,869 N load
By the DG method, the traditional design had to be submitted to different efforts for each mass variation for the program to generate plausible geometries with the mass of the desired design. Table 3 shows the variations found in DG1, DG2, DG3, DG4 and DG Extra designs.
The DG1 sample had its design compressive load of 400 N and in the test it supported 3,910 N, DG2 was designed for 500 N and supported 4,453 N, DG3 was designed for 1,000 N and supported 6,789 N, the DG4 sample was designed for 250 N e supported 2,896 N and the DG Extra sample was designed for 1,000N and supported 6,672 N. If it is taken into account that the strength of the printed material is 140 MPa, while the material chosen from the program library, called “Plastic” has strength of 40 MPa, if the tested part was this material, compression values of 1117 N, 1272 N, 1940 N, 828 N and 1906 N would be expected, which are much higher than the respective projected values, in some cases more than double.
As DG generates designs with irregular interior, all graphs have a first peak, but from that point there is no uniform pattern as the CP resistance can increase or decrease. There is a significant difference between the averages of the maximum forces of the DG3 and DG Extra samples, with a significance level of 0.05, according to Fisher’s F statistical test, with the DG3 value being higher, despite having a lower MC.
Table 3: Compressive strength of samples obtained by OT
COMPARISON OF RESULTS
The MC values (maximum load [N]/mass of printed material [g]) of the 11 samples were compared. In figure 6, on the abscissa axis the samples are in increasing order of mass.
Figure 6 : Load/Mass Ratio
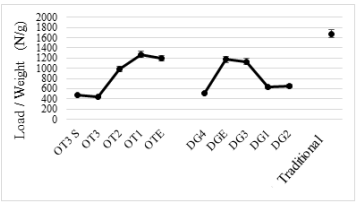
In the OT samples, there was a linear correlation between the increase in MC and the increase in mass in samples OT1, OT2 and OT3. The statistical test did not reveal a significant difference between the maximum strength of the Smoothed OT3 and OT3 samples. Thus, smoothing the sharp edges (post-processing) did not bring any structural benefit. However, the OT Extra sample presented a lower mean MC than the OT1.
Table 4: Compressive strength of the samples obtained by the DG.
In DGs samples, two typical profiles were observed. In profile 1 the samples have the most centralized internal structural material (DG4, DG1 and DG2) (Figure 7) and in profile 2 the samples have the most peripheral structural material (DG Extra and DG3) (Figure 8).
Figure 7 : Profile DG samples 1
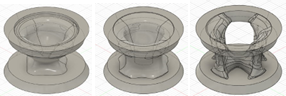
Figure 8 : Profile DG samples 2
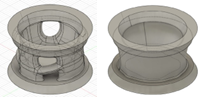
DGs samples only showed a pattern of maximum force increase with mass increase in profile 1 samples. In figure 6, it is possible to see the linear relationship between force and mass in samples generated by OT and profile 1, but profile 2 is the most recommended when there is a need to support greater loads (having a larger CM).
For profile 1, the greater the sample mass, the greater the CM. For profile 2 there was no such behavior.
Comparing the results of the samples with greater mass reduction between the DG and OT methods (DG4 and Smoothed OT3) it is observed that the DG4 sample has 4.9% more mass, but supports an 11.4% greater load, presenting a clear improvement in the CM relationship.
Observing the samples with less mass reduction (OT1 and DG2) it is observed that OT1 supported 84.5% more load despite having 94.3% of the mass of DG2, justifying the OT for small mass reductions, while the DG is valuable for proposals with greater mass reductions compared to conventional geometries.
Comparing the best performing design, DG3, and the DG Extra design (both with a design load of 1000 N), it was found that both have mass concentration in the periphery, but DG Extra is more homogeneous, resulting in a greater optimization of use. of the material and higher CM.
COMPARISON OF RESULTS OBTAINED WITH SIMULATIONS IN AUTODESK FUSION 360
Tables 2 and 3 present the simulations performed in Autodesk Fusion 360 with all designs. Massive plastic bodies were considered, as the program does not simulate parts manufactured by AM. For the OT designs, the input load in the simulation was the failure value itself in the traditional sample. In the DG samples, it was simulated for the design load and for the failure load.
The blue color indicates regions where the material is not required, the green color where the material is safe, the yellow color where the part may fail, and the red color where the part is likely to fail.
The regions where the first permanent deformations of the CPs occur are the most critical areas in the design simulation. In the simulations with the fault load, the regions where the fault would probably occur and where the greatest deformations would occur (regions in red) were observed. Such predictions could be confirmed by the photos of the CPs under test.
In the design simulation, it was possible to observe regions where the part could fail only in samples DG1 and DG3.
COMPARISON OF A SAMPLE FAILURE WITH DIFFERENT PRINT SEAM LOCATIONS
In the OT Extra sample, it was possible to analyze the consequences of the position where the printing initialization seam was performed. In two CPs of the group, the seam coincided with the direction of an empty space of the piece (right side of the image), and in the other three CPs the seam was in a massive region (left side of the image) as shown in figure 9.
Table 5: Comparison of the test failure simulations of the traditional and OT samples
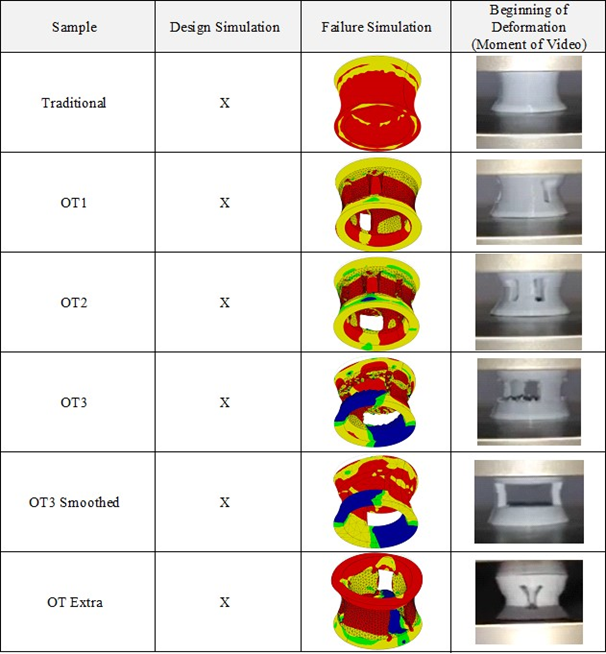
Table 6: Comparison of the test failure simulations of the traditional and DG samples
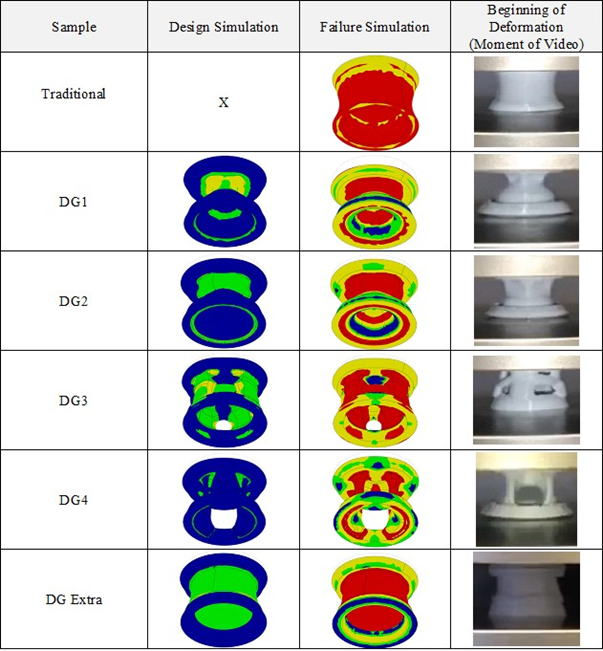
Figure 9: Boot Seams
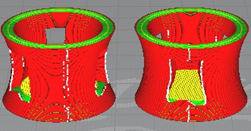
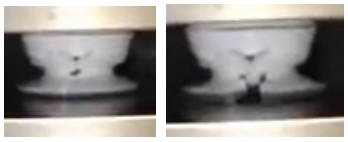
The position of the seams did not compromise the maximum load supported, but the minimum point of the graphics was affected. The seam location broke during the experiment only in the CPs with seam in the direction of the part opening, causing a more sudden load drop to the minimum point. However, this opening happened after the failure of the material, acting only in the decrease of the minimum point of the force (N) x Displacement (mm) graph, without relation to the maximum resistance. The before and after images of the seam opening moment can be seen in figure 10.
Figure 10 : Moment of initialization seam fracture
PRODUCTION TIME
Using Cura Ultimaker software, the time for printing the seven CPs of the traditional sample and the samples with less mass (Smoothed OT3 and DG4) was calculated. DG showed a reduction in the printing time of CPs, 11.9%, while OT reduced 4.8%. It was concluded that the DG offers a greater applicability of production by AM.
CONCLUSIONS
The CM ratio was not increased with the application of DG and OT methods, since the highest CM ratio was found in the traditional design, because when mass is reduced, maximum strength and CM ratio decrease.
It was observed that the real part supported much more than the projected one, even with a safety factor equal to 1, indicating that, if the objective of the sample design was to support such loads (400 N, 500 N, 1,000 N and 250 N) parts could be considerably lighter.
When there is a pre-requisite of compressive load, the OT for mass reduction is not ideal, as the force input parameter does not block the mass reduction, allowing the extreme embrittlement of the part. DG, on the other hand, is safer because it asks for the desired maximum load as the input and only then proposes a geometry.
The location of the print seam had no relevance in the result of the maximum load supported by the part, only at the minimum point where the opening of the part is located if it is located in the direction of an empty space in the part.
As the results obtained in the tests showed that the supported load is different from the input values as requirements of the optimization methods, it is recommended that these be used as a starting point for obtaining the geometries, performing mechanical tests to attest to their real properties, because may be influenced by the manufacturing method and raw material.
It is important to note that in OT a simulation is required to obtain each design. Thus, when comparing designs even with the same design objectives and requirements, new simulations will be necessary, making the selection process time consuming due to repeated creation of reference geometries, preparations and execution of simulations and tests. On the other hand, in the DG
method it is possible to obtain multiple design options that all meet the requirements and objectives of the project simultaneously in the same simulation, allowing the designer to easily compare all the options and make his choice more quickly.
REFERENCES
AMS BRASIL. Design generativo e o futuro da fabricação inteligente. Disponível em <https://amsbrasil.com.br/designgenerativo-e-o-futuro-da-fabricacao-inteligente/> Acesso em: 18 maio 2021.
AUTODESK. Fusion 360, disponível em <https://www.autodesk.com/products/fusion-360/overview?us_oa=dotcom-us&us_ si=7df82e85-7e1c-494f-8df9-2908d6835f5f&us_pt=NINVFUS&us_at=Fusion%20360> Acesso em: 18 maio 2021.
AUTODESK. Você sabe o que é Design Generativo? Disponível em <https://blogs.autodesk.com/por-dentro-da-autodeskbrasil/2016/07/18/voce-sabe-o-que-e-design-generativo/> Acesso em: 18 maio 2021.
AUTODESK: Otimização Topológica, Desenho Generativo…. estudo de caso …, disponível em <https://forums.autodesk. com/t5/fusion-360-portugues/otimizacao-topologica-desenho-generativo-estudo-de-caso/td-p/9812990> Acesso em: 18 maio 2021.
BANJANIN, Bojan; VLADIC, Gojko; PÁL, Magdolna; BALOS, Sebastian; DRAMICANIN, Miroslav; RACKOV, Milan; KNEZEVIC, Ivan.Consistencyanalysis of mechanicalproperties of elementsproduced by FDM additivemanufacturingtechnology. Revista Matéria,v. 23 n.4. ISSN 1517-7076 artigo e-12250, 2018.
BARBIERI, Loris.; MUZZUPAPPA, Maurizio. Performance-Driven Engineering Design Approaches Based on Generative Design andTopologyOptimization Tools: A ComparativeStudy. Appl. Sci., v.12, p. 2106, 2022. Disponível em: <https://doi. org/10.3390/app12042106>. Acesso em 20 fev. 2022.
BRACKETT, D; ASHCROFT, I.; HAGUE, R. TopologyOptimization For Additive Manufacturing. In: Proceedings of theSolidFreeformFabricationSymposium, Austin, TX, USA, 2011.
ESTERVELD, Claudia Elisabeth. Generative Design: Recommendedactionstosmooththeway for production of generative designs withadditivemanufacturing. Essay for Engineering Technology Masters for Industrial Design Engineering, University of Twente. 2021.
ESUN. Loja de filamentos importados, disponível emhttps://esunbrasil.com.br/loja/?swoof=1&product_cat=pla-2.Acesso em: 28/06/2022
ISO 604:2022 Plastics — Determination of compressiveproperties. Disponível em: <https://cdn.standards.iteh.ai/ samples/31261/7596c06eb39540f3ae2f1abcdae4fb79/ISO-604-2002.pdf> Acesso em: 18 maio 2021.
KATORI, Rosa. A aplicação da tecnologia de otimização topológica e design generativo para redução de peso em sólidos paramétricos em projetos mecânicos. São Paulo, 2020. ISBN: 978-65-00-03295-6.
KAUFUI, Wong; HERNANDEZ, Aldo. A review of additivemanufacturing. ISRN Mechanical Engineering, V. 2012, 2012. Article ID 208760, 10 pages, doi:10.5402/2012/208760
KENNEDY, Kevin. FreeGenerative Design – Beginner Fusion 360 Tutorial. Disponível em <https://www.youtube.com/ watch?v=PSSt8wswNJQ&t=453s&ab_channel=ProductDesignOnline> Acesso em: 18 maio 2021.
KRISH, Sivam. A PracticalGenerative Design Method.Computer-Aided Design, v. 43 p. 88-100, 2011.
GROOVER, Mikell P.; ZIMMERS JR., Emory W. CAD/CAM: Computer-Aided Design and Manufacturing. New Jersey: Prentice Hall, 1984.
NTINTAKIS, Ioannis, STAVROULAKIS, George E. ProgressandRecentTrends in Generative Design.MATEC Web of Conferences318, 01006, 2020. https://doi.org/10.1051/matecconf/202031801006
¹Federal Technological University of Paraná (UTFPR), Curitiba, PR